Arctic sea ice likely reached its maximum extent for the year on March 15, 2026, according to the National Snow and Ice Data Center (NSIDC). At 5.52 million square miles (14.29 million square kilometers), the 2026 maximum extent was tied with 2025’s maximum for lowest in the 48-year satellite record. [Extents within roughly 11,600 square miles (30,000 square kilometers) are considered statistically tied.]
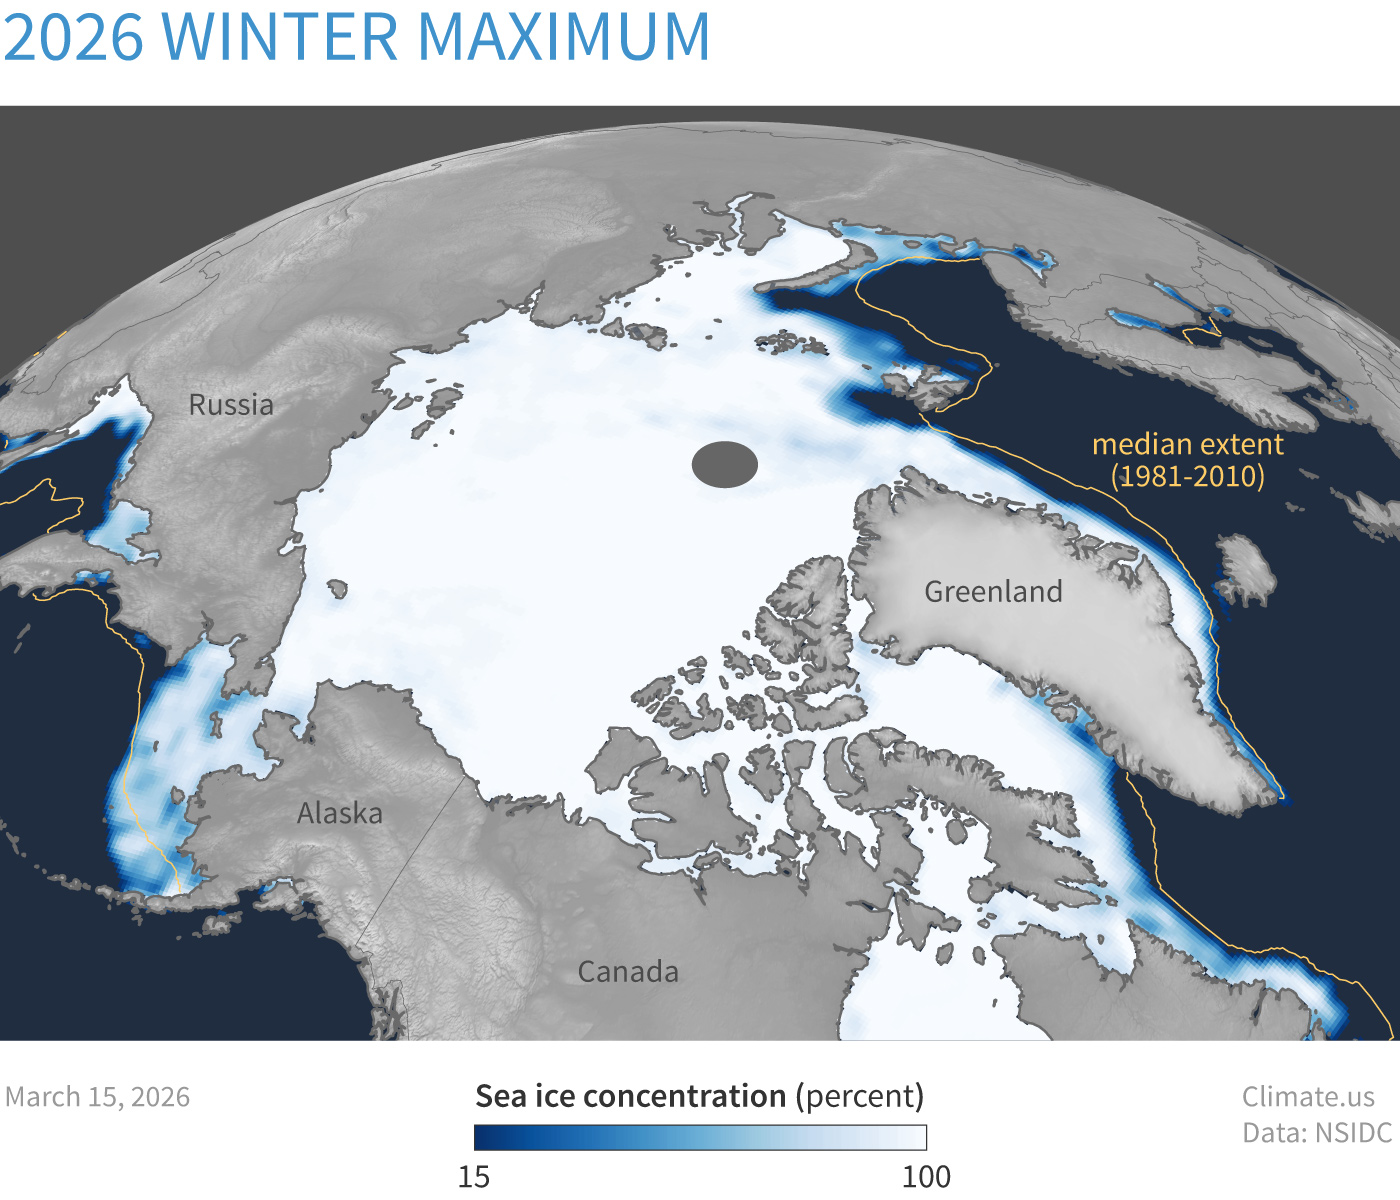
In discussing the 2026 Arctic sea ice winter maximum, NSIDC scientists stressed that the Arctic sea ice extent number was preliminary. Weather conditions still held the potential to change the annual maximum ice extent. Since March 15, Arctic sea ice extent has remained among the lowest—but not the very lowest—on record for the given time of year. See NSIDC’s Charctic tool to visualize current and historical sea ice extents throughout the year.
Northern Hemisphere spring marks the beginning of the Arctic sea ice melt season, which continues until the September minimum. “The melt season is starting off on a bad footing,” said NSIDC director Mark Serreze, “but there is no correlation between the winter maximum extent and the following summer minimum extent.”
“We’ve now had two years in a row with record-low winter maximum extents,” said NSIDC senior research scientist Walt Meier. “These extents are not very significant in and of themselves, but they reinforce Arctic sea ice’s significant long-term downward trend.” The March trend for Arctic sea ice, over 1979-2026, is a decline of 2.5 ± 0.4 percent per decade, according to NSIDC.
This decline in ice cover at the end of winter is small compared to the decline in ice cover at the end of summer. But winter ice has changed significantly in a different way: thickness.
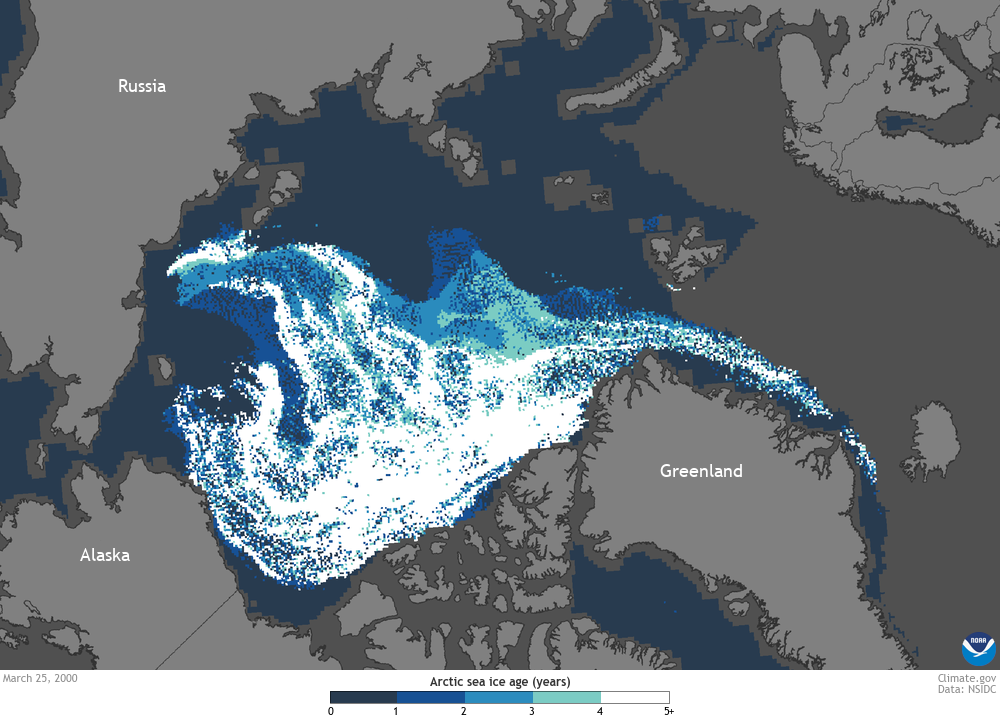
Historically, much of the Arctic remained ice covered even in the summer. Ice grew thicker year after year as it drifted around the Arctic. Because so much of the Arctic Ocean is ice-free at the end of the summer nowadays, much more of the ice cover at winter maximum is thinner, more fragile ice less than a year old.
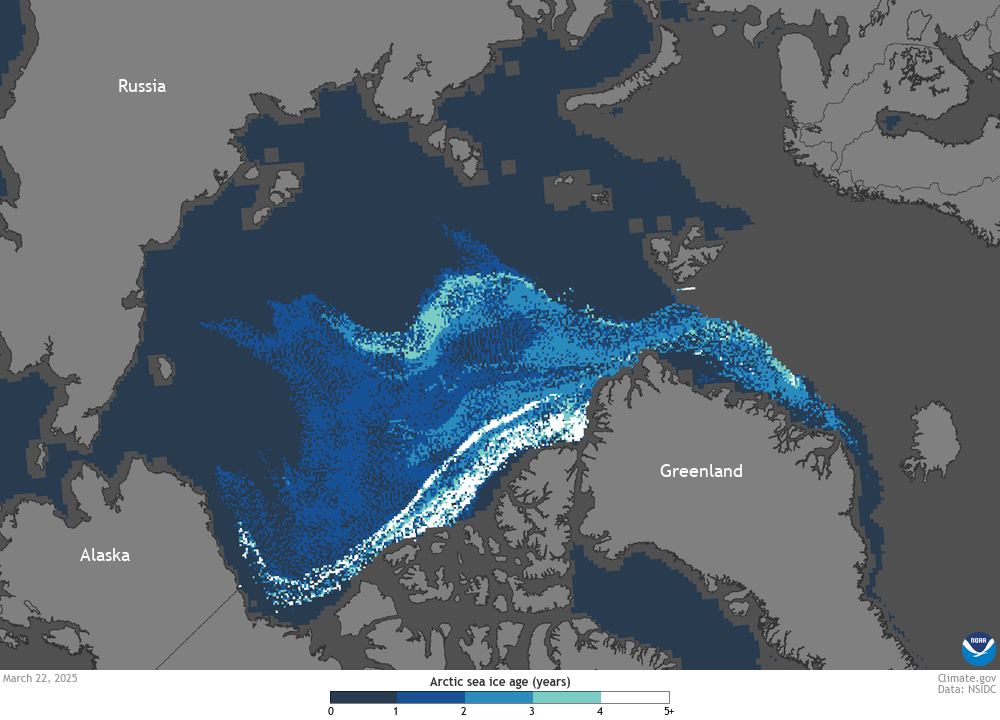
Thinner winter ice helps perpetuate big summer declines. It is more likely to break up with wind and waves, and more likely to melt dramatically in an unusually hot summer. Thin ice is also a problem for Arctic residents whose communities, livelihoods, and traditions depend on the protection and stability of thick ice.