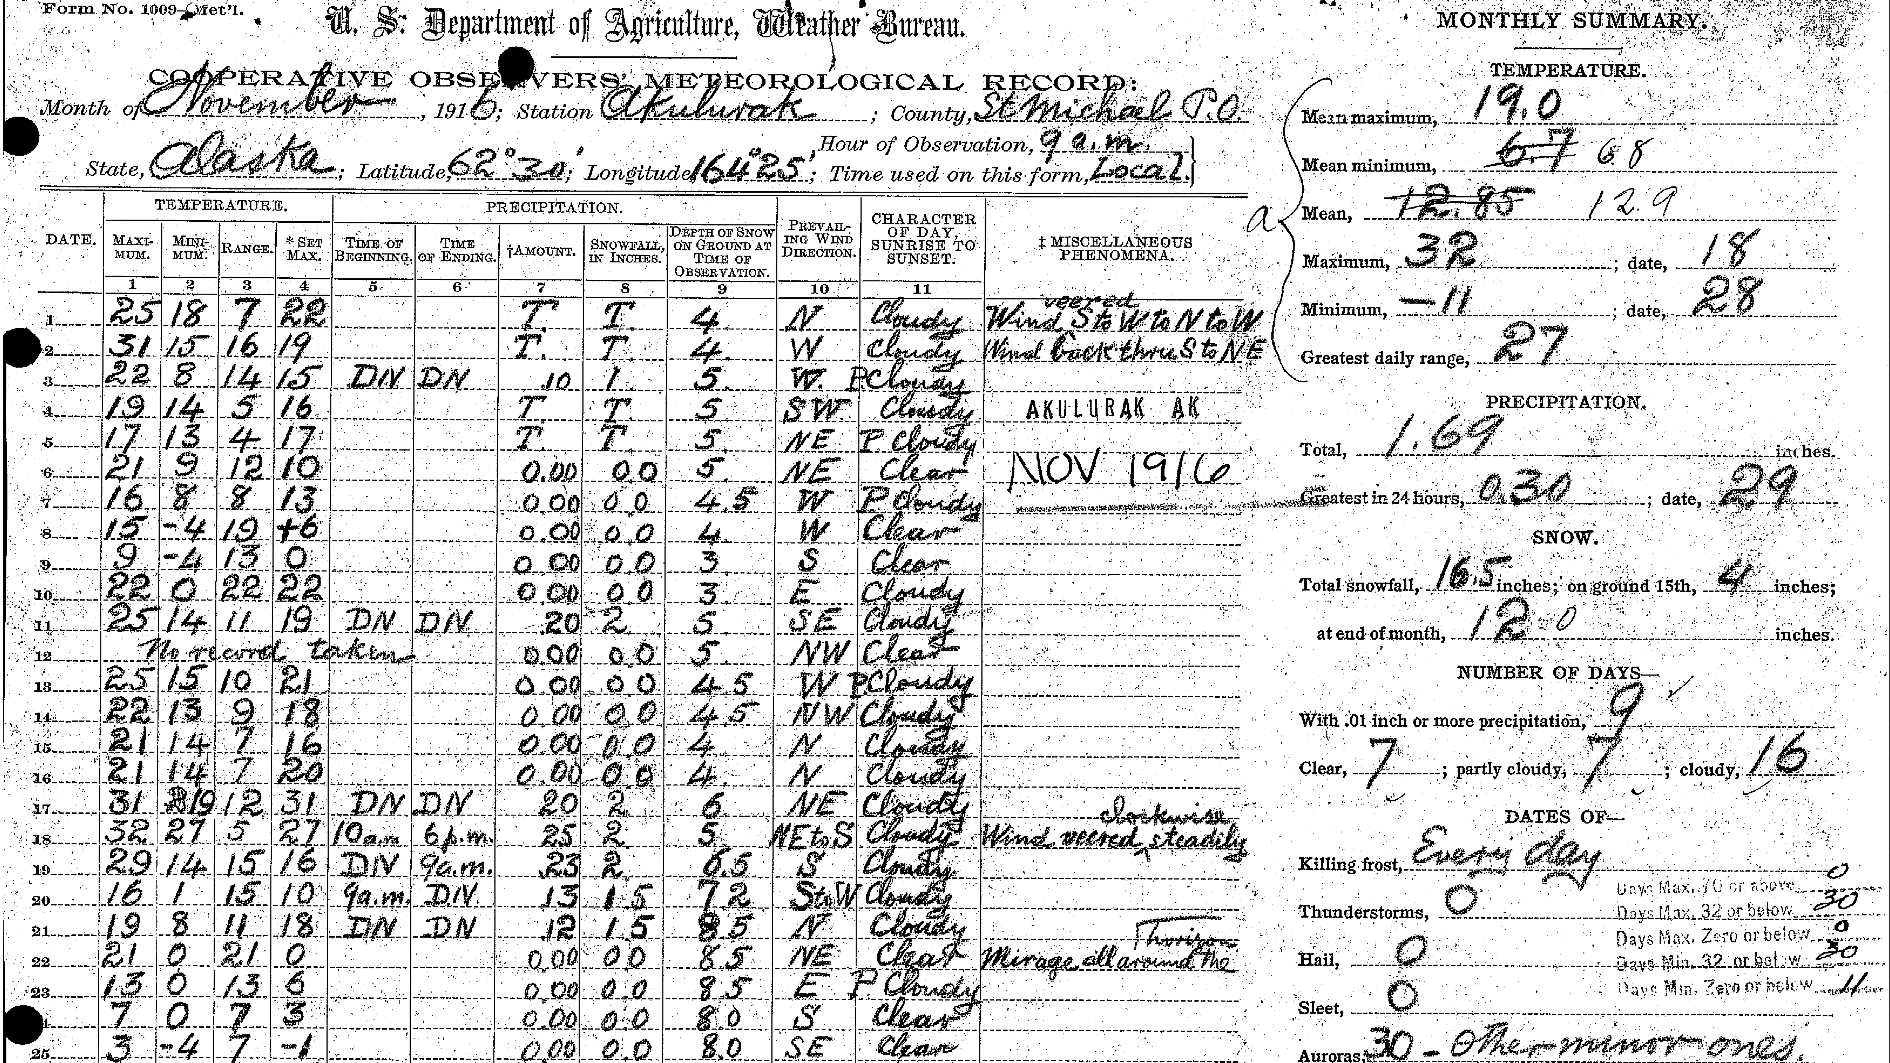
Through the National Weather Service (NWS) Cooperative Observer Program (COOP), more than 10,000 volunteers take daily weather observations.
Through the National Weather Service (NWS) Cooperative Observer Program (COOP), more than 10,000 volunteers take daily weather observations.
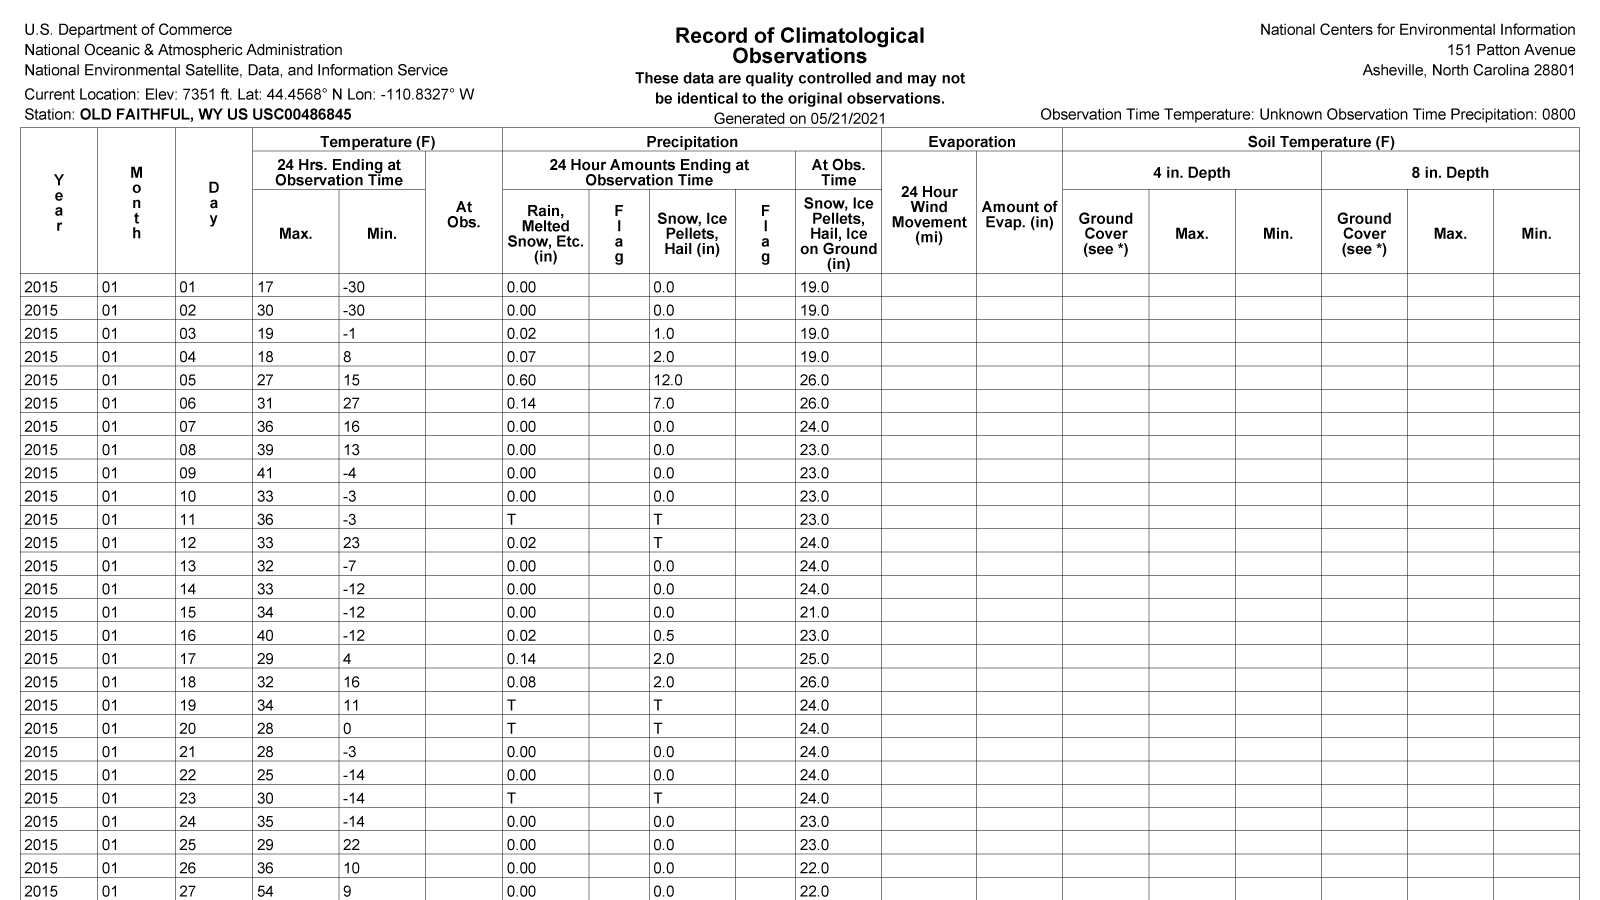
Daily GHCN summaries answer questions such as, what were the high and low temperatures at a station on a specific day; how much did it rain last Wednesday; or how much snow was on the ground on a recent date?
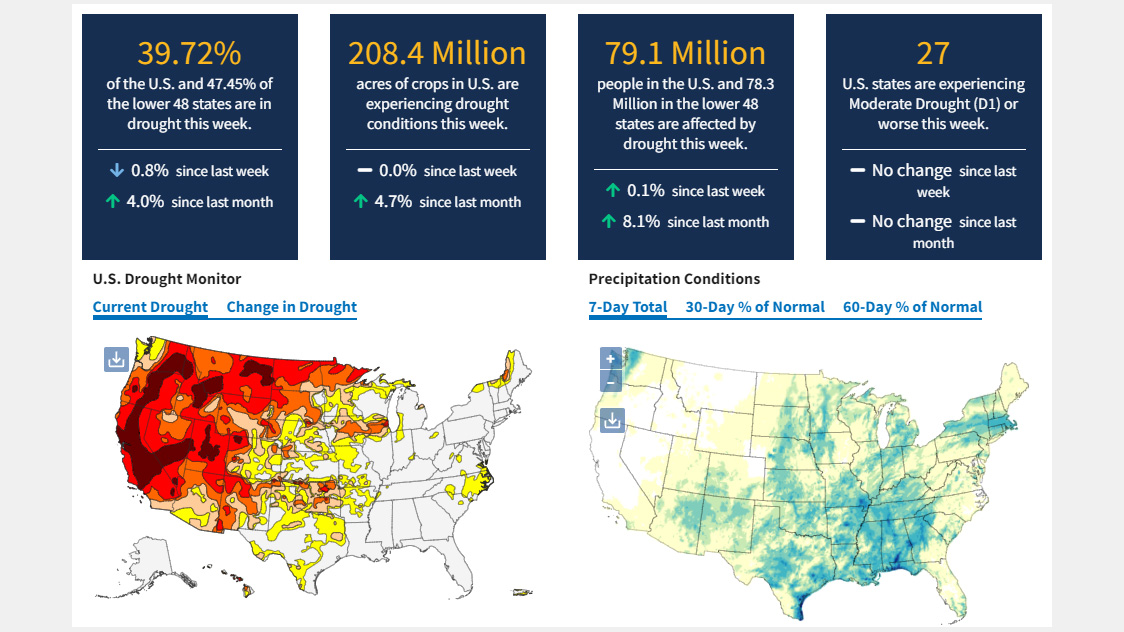
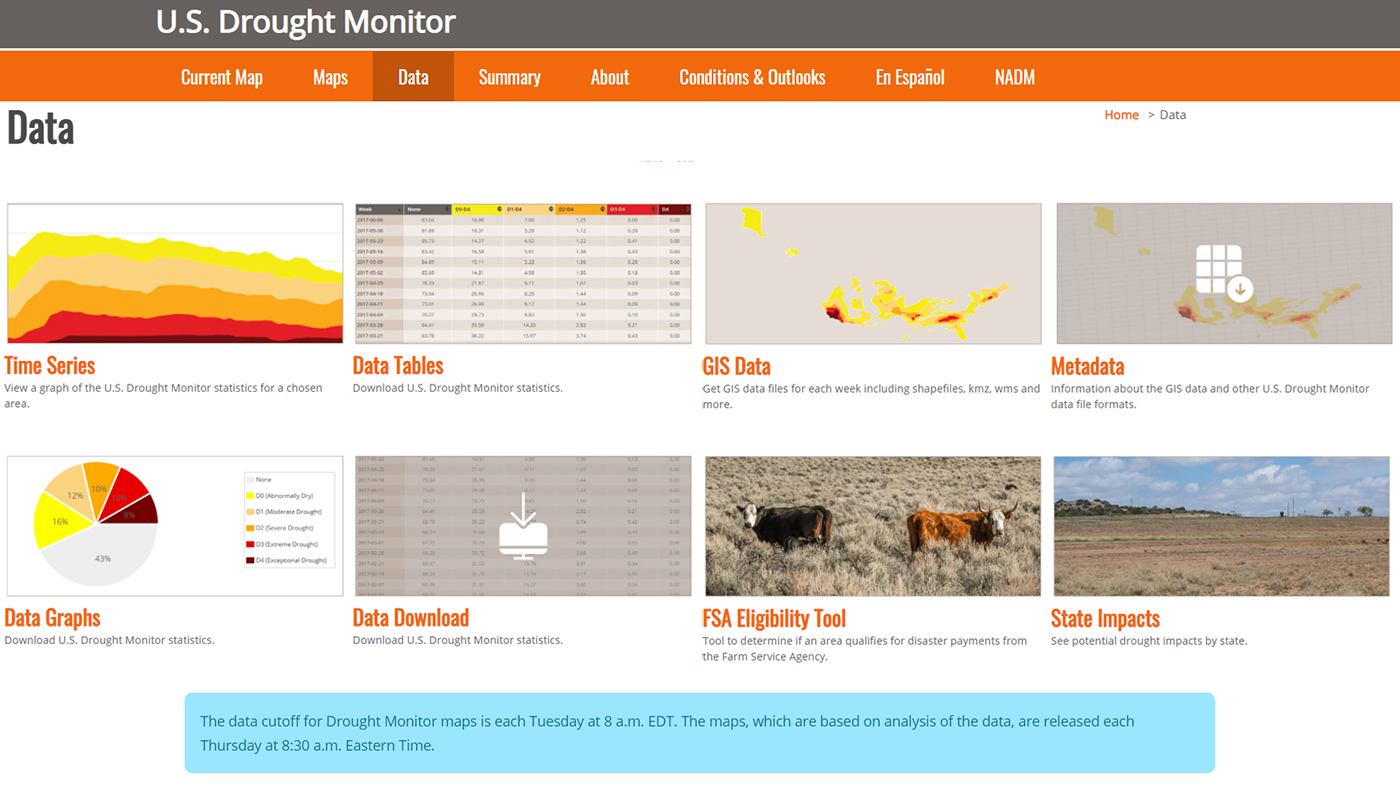
A one-stop shop for current, reliable, and useful information and resources related to drought conditions and associated risks.
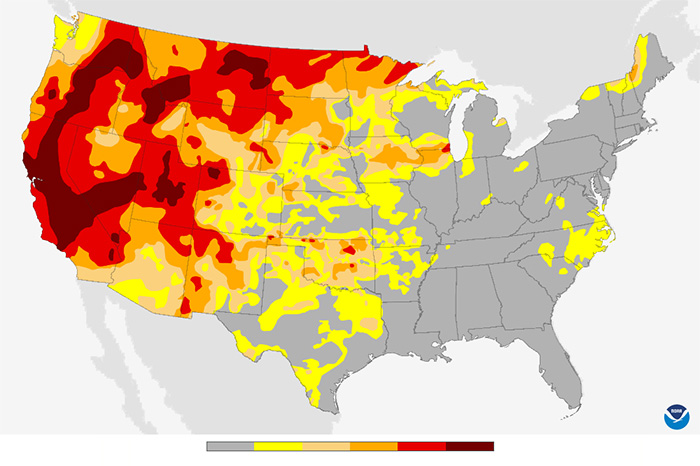
Colors show experts' assessments of conditions related to dryness and drought. These maps focus on broad-scale conditions, so local conditions may vary. Categories reflect how much water is available…
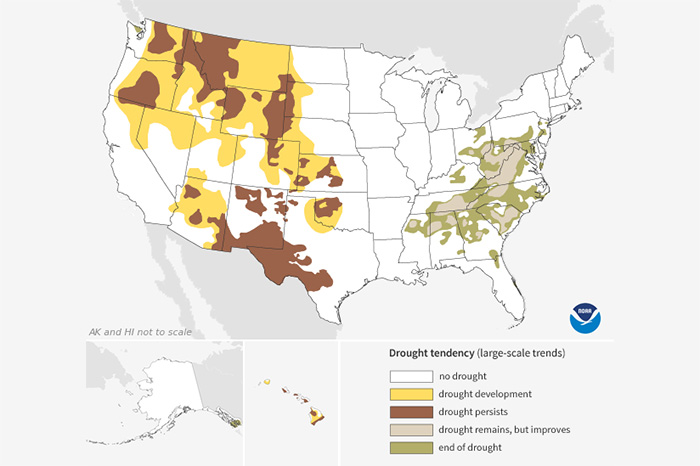
Colors on each map show experts' estimates of how conditions related to drought are likely to change by the end of the next month. Areas where experts expect below-average precipitation or above…
The Drought Risk Atlas provides historic data about drought for weather stations across the United States that have at least 40 years of records.
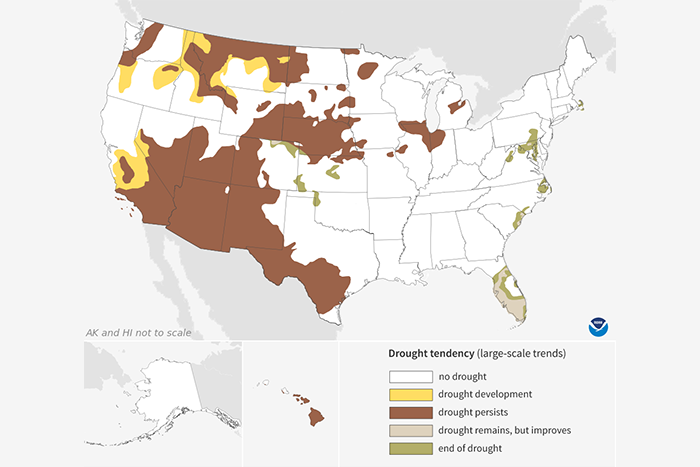
Colors on each map show experts' estimates of how conditions related to drought are likely to change by the end of the next three months. Areas where experts expect below-average precipitation or…
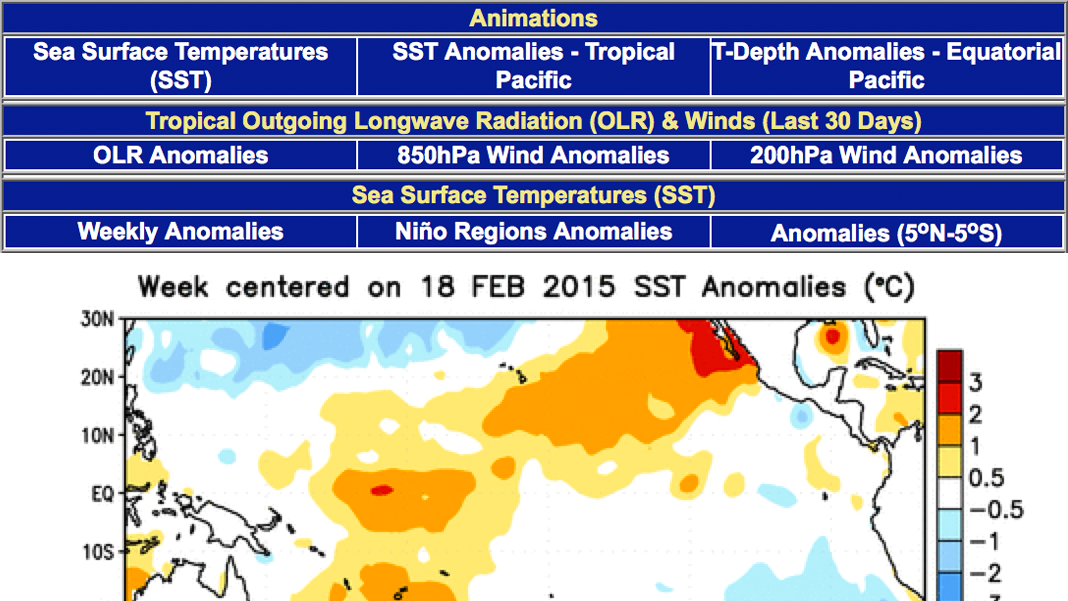
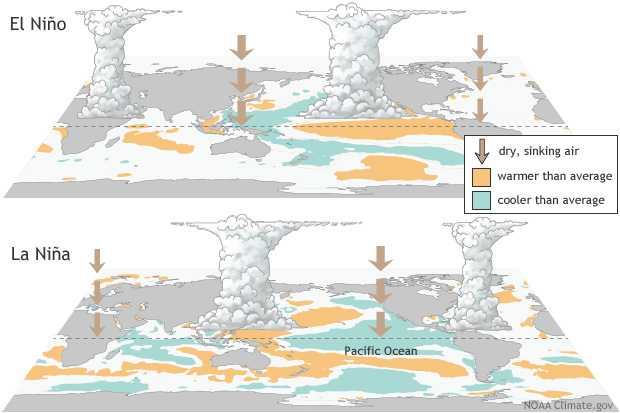
Current CPC information related to the El Niño-Southern Oscillation (ENSO), including technical information for forecasting impacts in the United States.
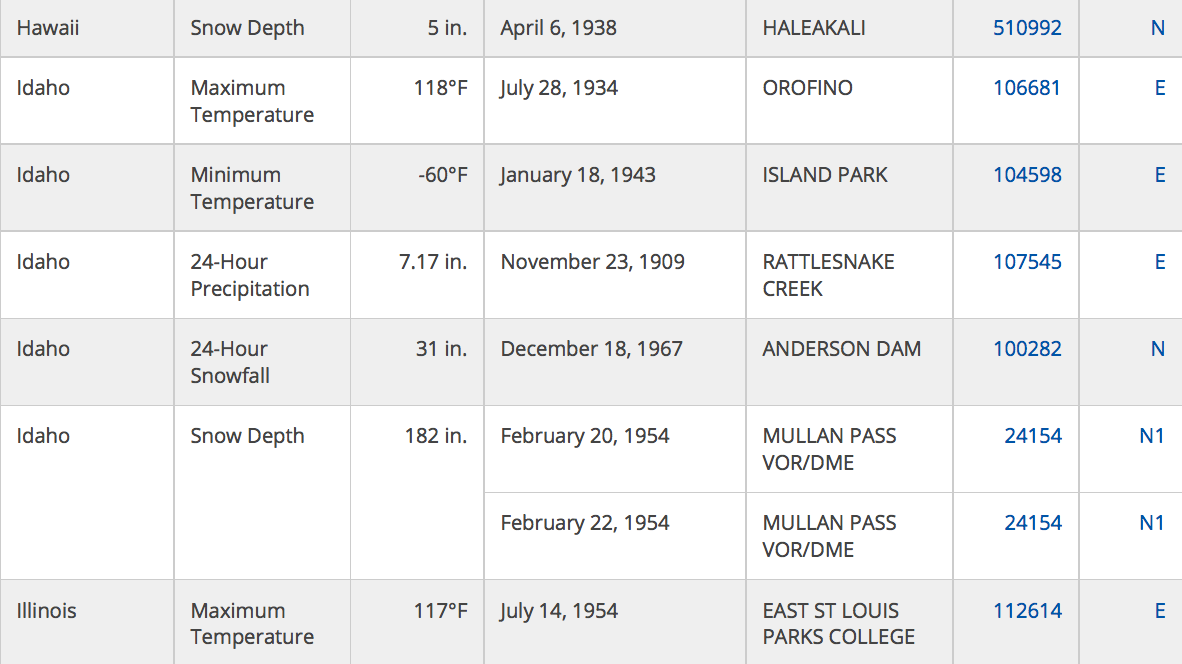
Records for every state in categories such as temperature, total amount of rain or snow in 24 hours, weight and diameter of hail-stones, and highest wind gusts.