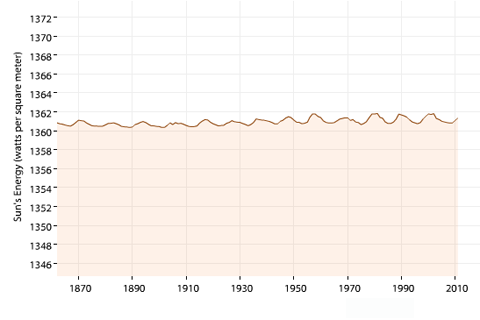
The Sun's average brightness varies over time, and the changes can affect global surface temperature. But long-term changes over the period of human-caused global warming are minimal.
The Sun's average brightness varies over time, and the changes can affect global surface temperature. But long-term changes over the period of human-caused global warming are minimal.
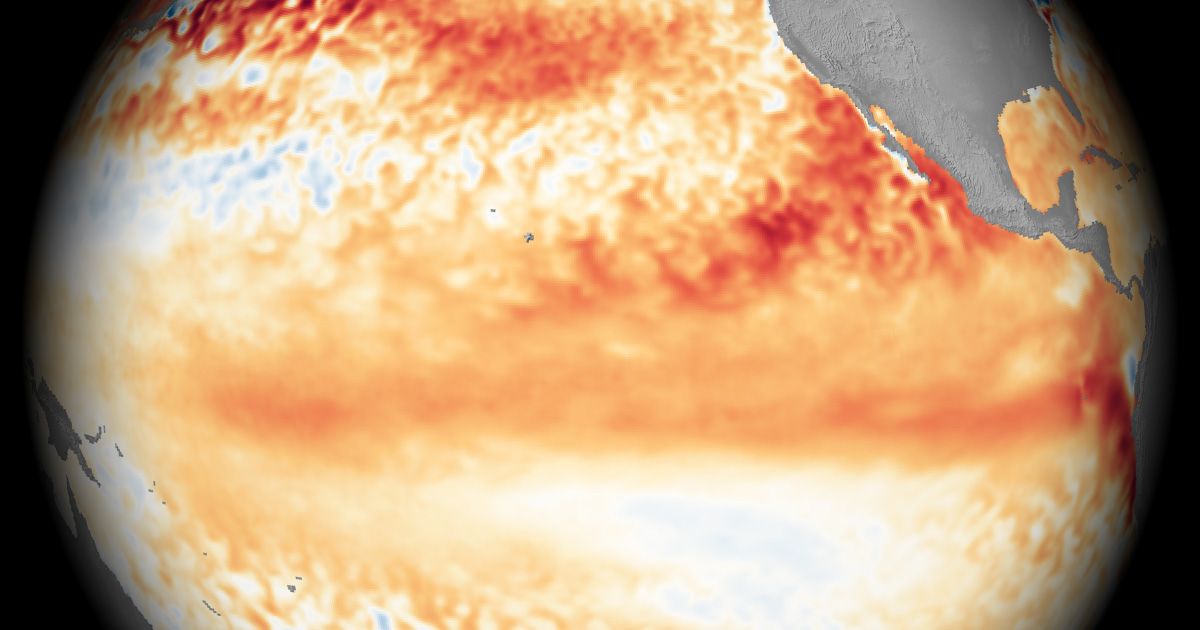
Free to good home! Almost all Climate.gov and Climate.us images are free for re-use. This page gathers up links to our most popular El Niño and La Niña images.
As of 2024, the warming effect of long-lived greenhouse gases in Earth's atmosphere had increased by 54% compared to 1990. Relative to pre-industrial times, today's atmosphere absorbs 3.54 extra Watts of heat energy per square meter.
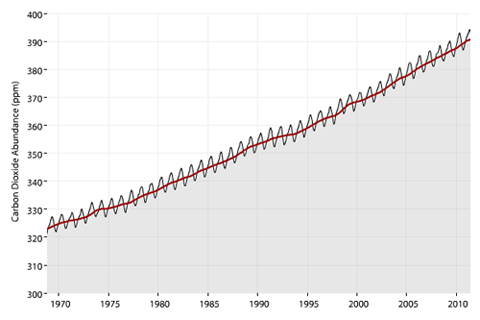
In the past 60 years, carbon dioxide in the atmosphere has increased 100-200 times faster than it did during the end of the last ice age.
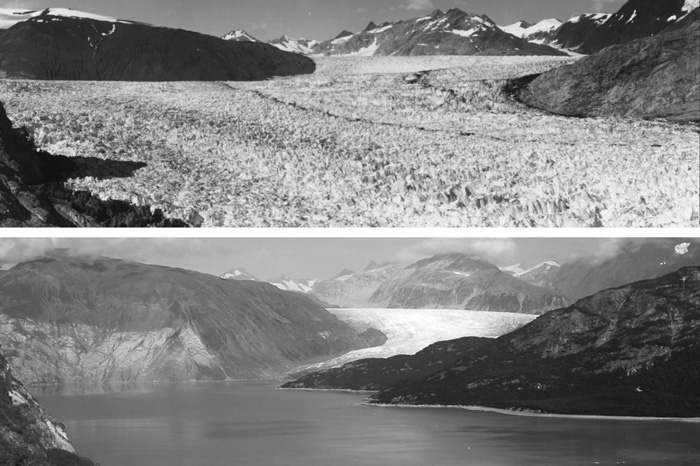
Present since the last ice age, most of the world's glaciers are now shrinking or disappearing altogether as the climate gets warmer.
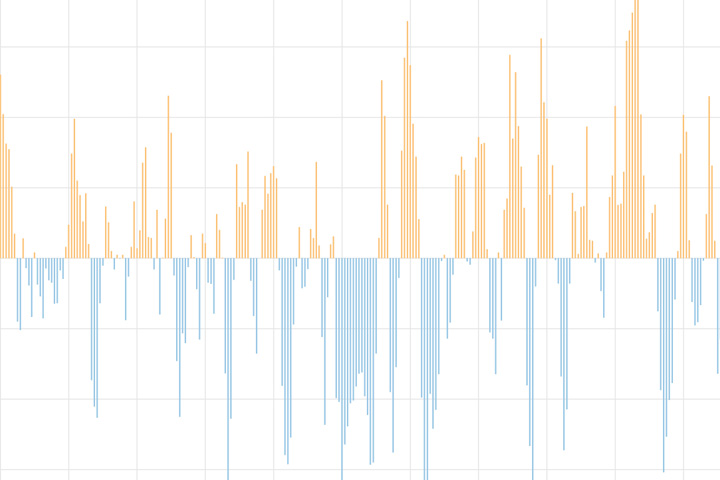
The North Atlantic Oscillation tracks a seesawing of surface pressure between two parts of the North Atlantic. Different phases often bring predictable changes in winds, temperature, and precipitation in the United States and Europe.
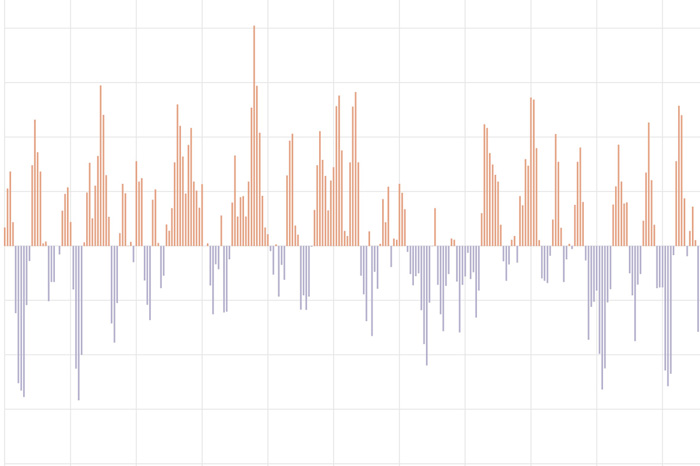
The Pacific-North American teleconnection pattern influences regional weather by affecting the strength and location of the East Asian jet stream, and subsequently, the weather it delivers to North America.
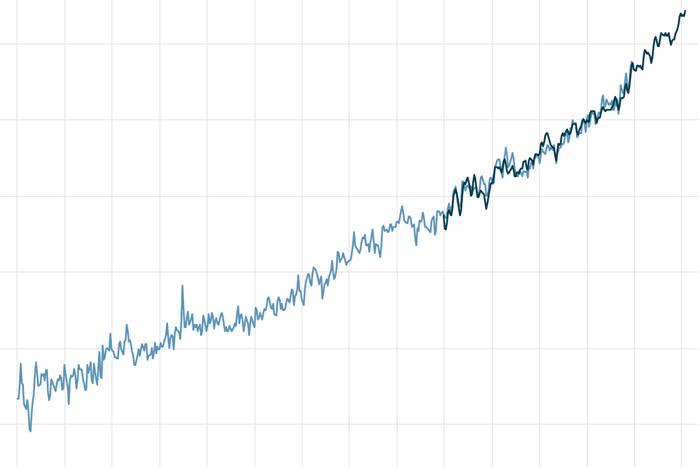
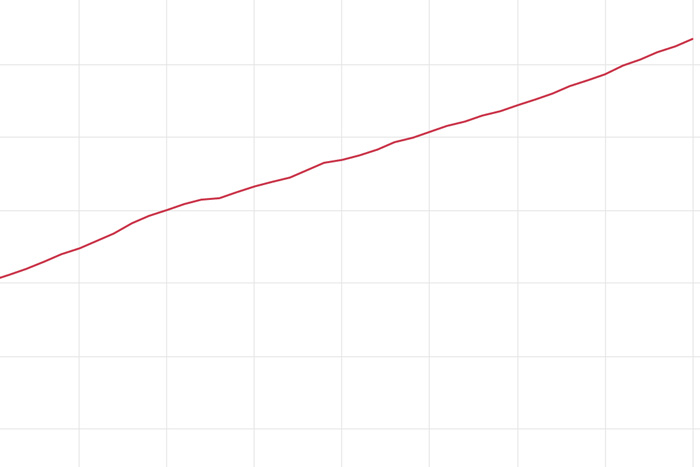
Global average sea level has risen at least 8-9 inches since 1880, and the rate is accelerating thanks to glacier and ice sheet melt.

Antarctic sea ice extent hit a record low extent in February, but thanks to large natural variability from year to year, experts say there is still no long-term trend.
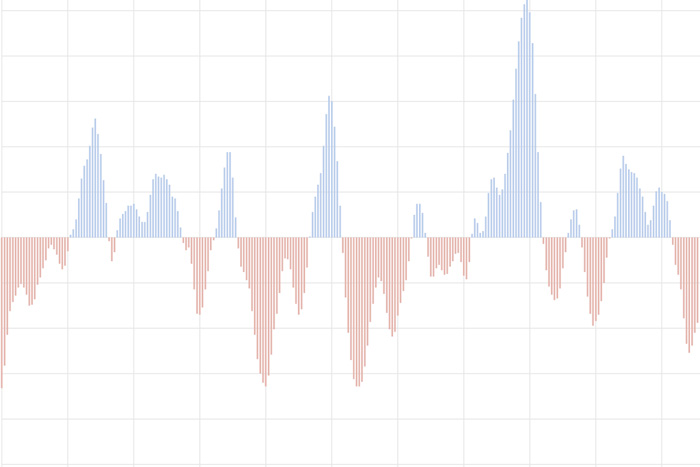
The Relative Oceanic Niño Index tracks sea surface temperature in the east-central tropical Pacific Ocean. It is NOAA's primary indicator of El Niño and La Niña.