Seasonal surface temperatures anomalies (difference from the 1991-2020 average) in the central tropical Pacific Ocean relative to the average anomaly of the entire tropical ocean. Values of 0.5 and higher indicate El Niño. Values -0.5 and below indicate La Niña. Data from NOAA CPC.
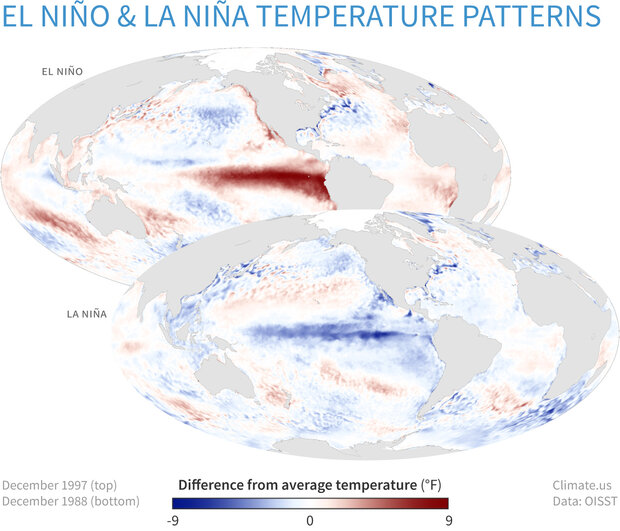
Difference from average sea surface temperature across the tropical Pacific Ocean during a strong El Niño (top) and a strong La Niña (bottom). During El Niño, the east-central tropical Pacific is warmer than average. During La Niña, the region is colder than average. Data from NOAA NCEI.