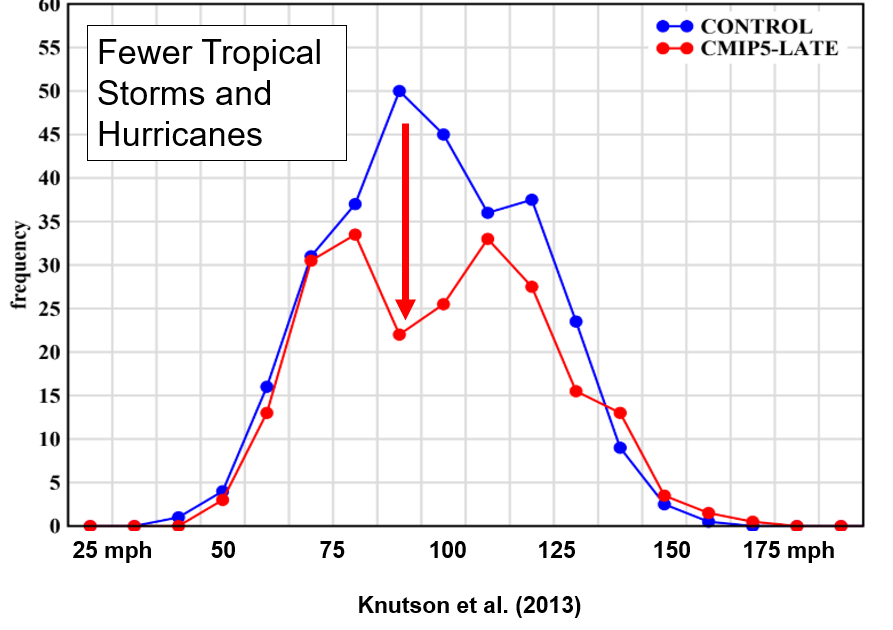
The frequency of maximum winds speeds of various strengths in today's climate (blue line) and a future climate (red line) with substantial increases in greenhouse gases. Same figure as above, but highlighting the projected drop in weaker storms. Figure courtesy Chris Landsea.