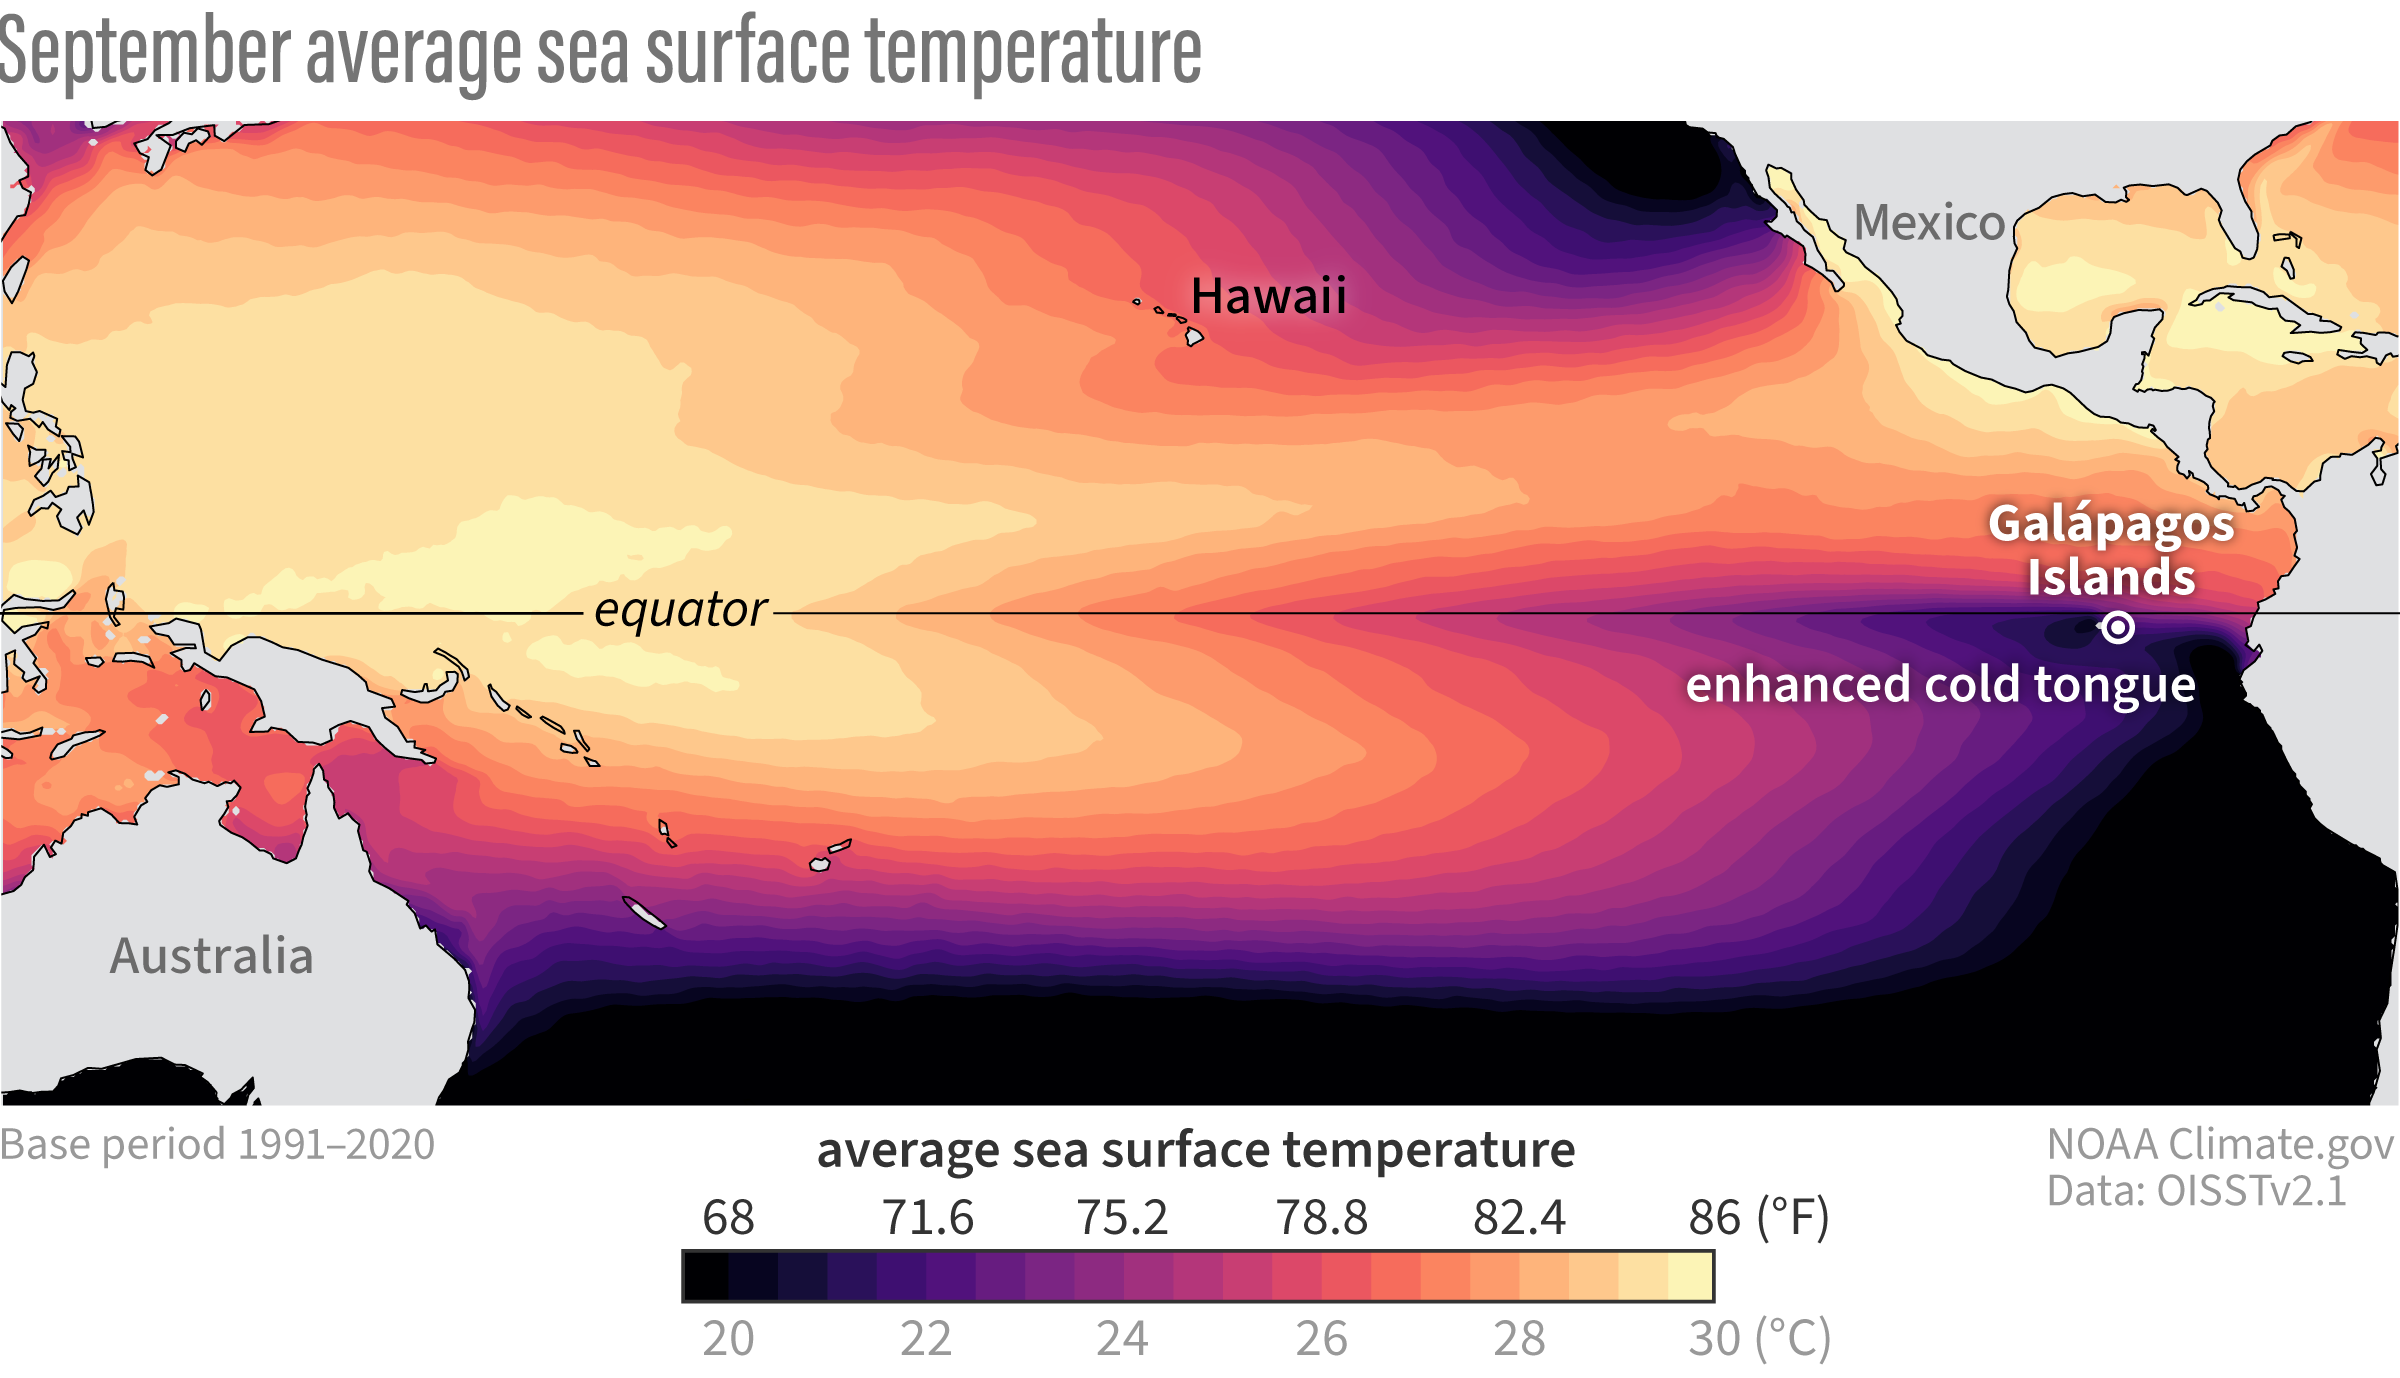
Average sea surface temperatures during September over the 1991-2020 period. Darker shading indicates comparatively cooler temperatures and brighter shading indicates warmer temperatures. Map by Climate.gov based on analysis by M. L'Heureux.
Average sea surface temperatures during September over the 1991-2020 period. Darker shading indicates comparatively cooler temperatures and brighter shading indicates warmer temperatures. Map by Climate.gov based on analysis by M. L'Heureux.