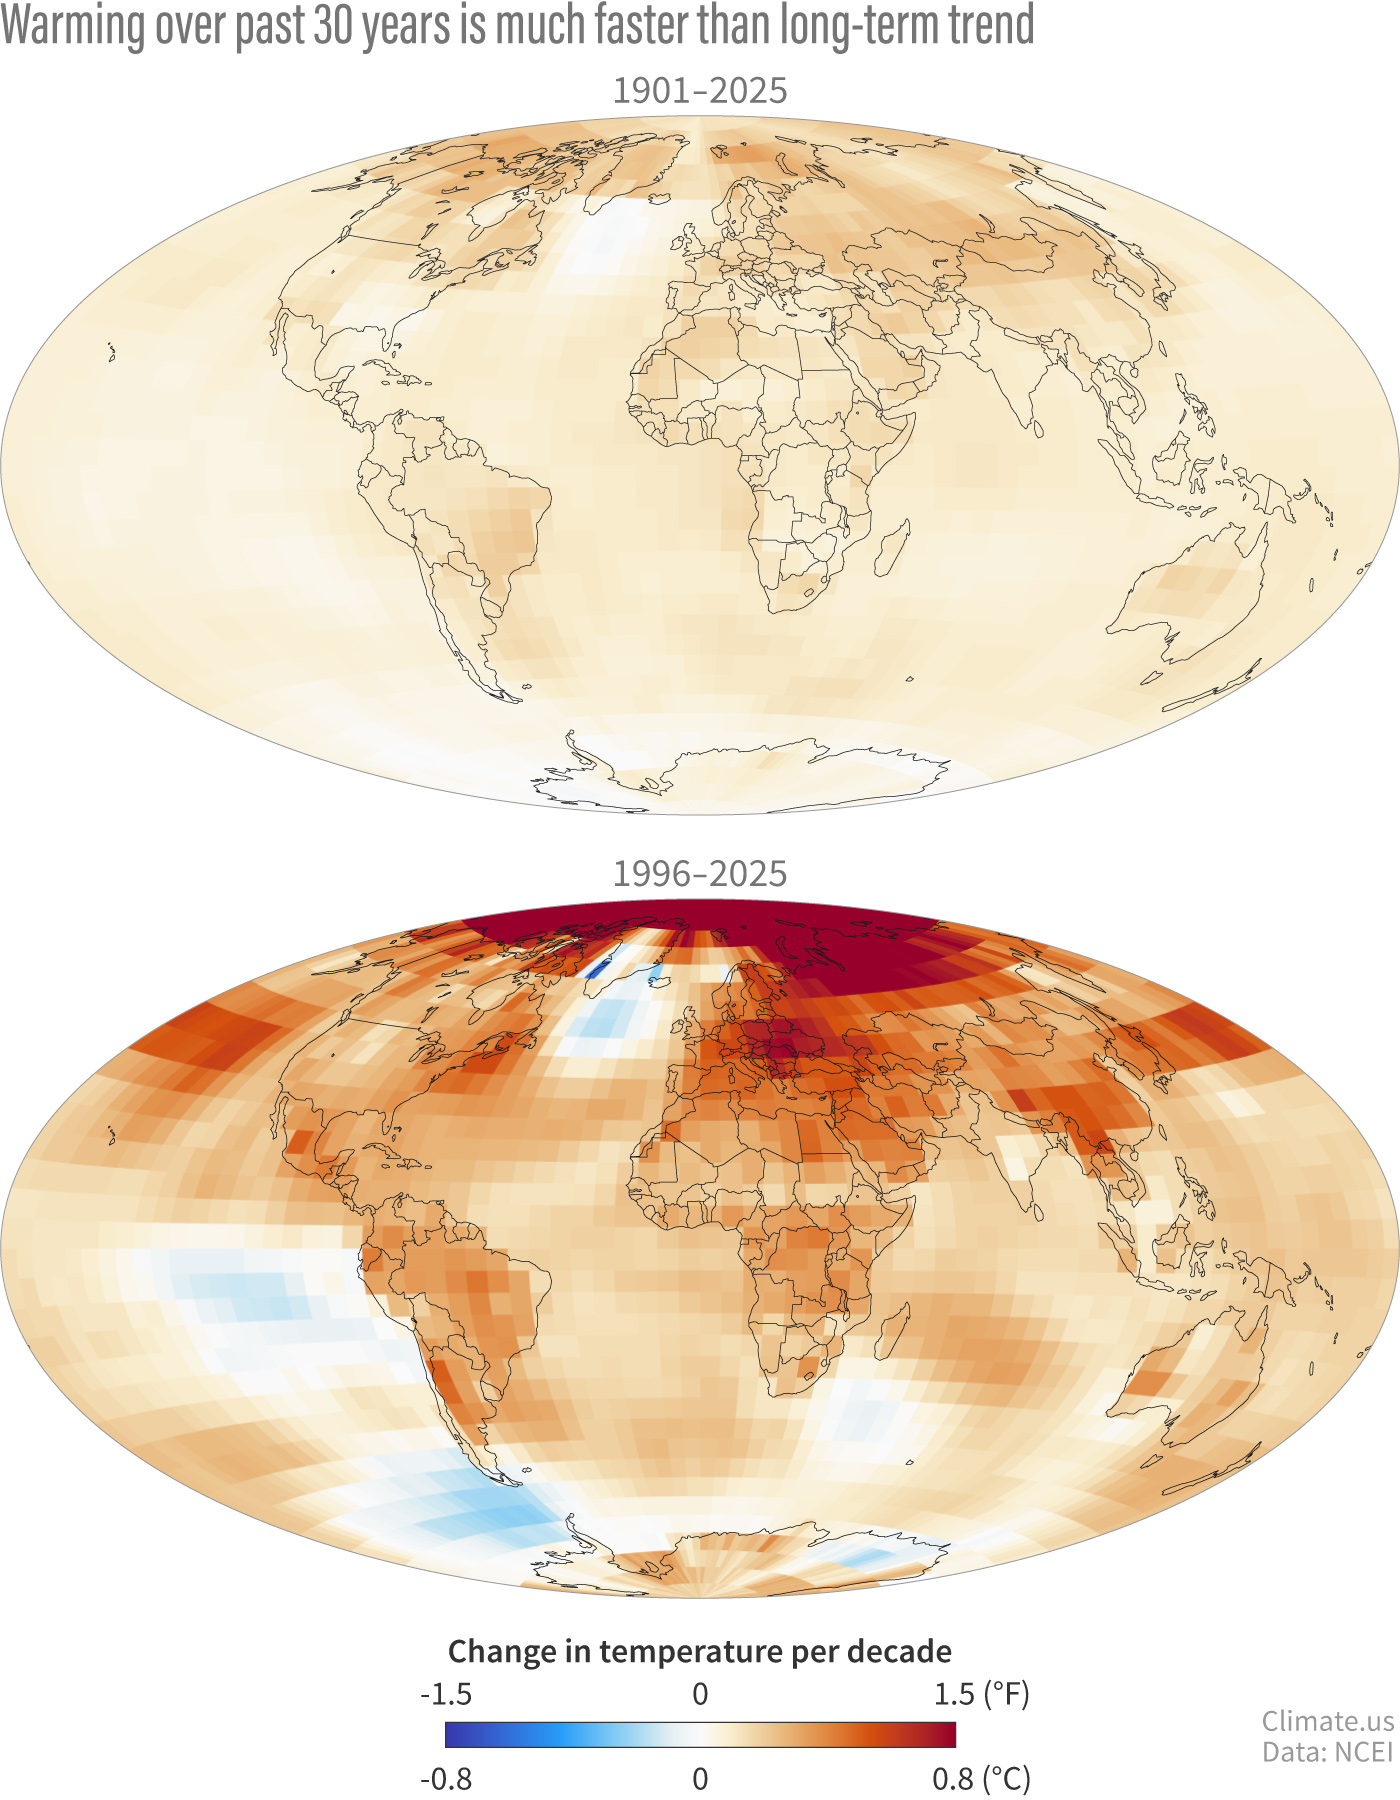
The rate of global warming has been faster in the past three decades (1996-2025, bottom map) than it was over the century-plus time scale (1901-2025, top). Places that have cooled are colored blue; places that have warmed are colored yellow, orange, or red. In the past three decades, many places in the Northern Hemisphere have warmed by 1 degree Fahrenheit or more per decade. Differences are most dramatic in the Arctic. With the decline of ice and snow, the Arctic reflects less incoming sunlight, which amplifies the rate of greenhouse-gas-driven warming. Climate.us maps, based on data provided by NOAA National Centers for Environmental Information.