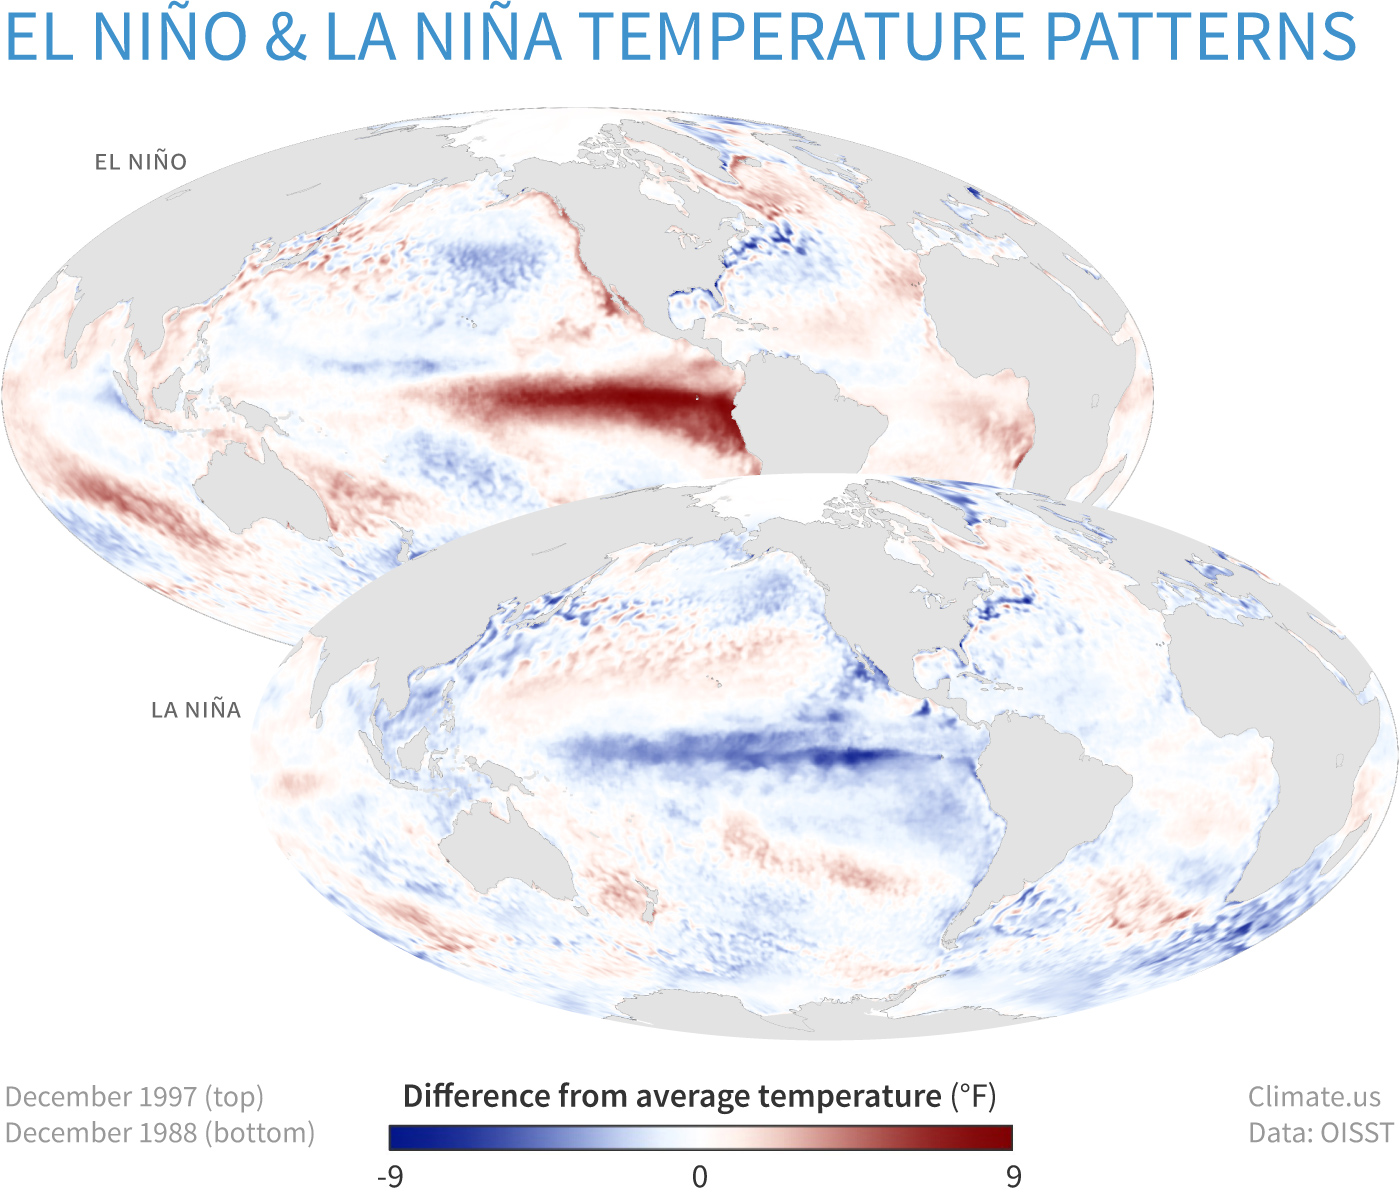
Sea surface temperature across the tropical Pacific Ocean in December 1997 (top), during a strong El Niño, and in December 1988 (bottom) during a strong La Niña. The ONI only tracks the temperatures in the Niño3.4 region, but during strong events, the entire central and eastern tropical Pacific will generally become warmer or cooler than average. Maps by Climate.us, based on data from NOAA's Physical Science Lab.