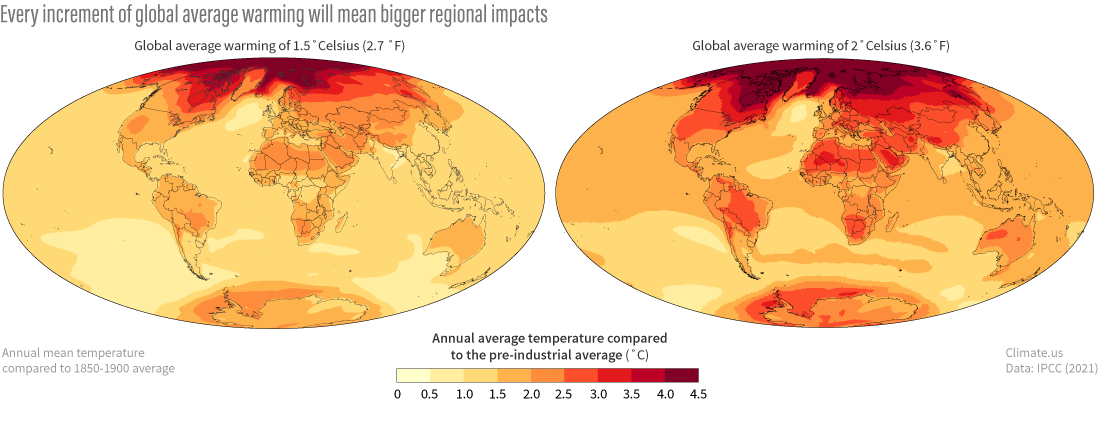
At global average warming levels of 1.5 degrees Celsius (left) above Earth's pre-industrial temperature, some land areas will experience twice that much annual warming. At global warming of 2 degrees Celsius, those regional differences become more extreme. Climate.us maps, based on data from Figure 5 of the IPCC Sixth Assessment Report's Summary for Policymakers.