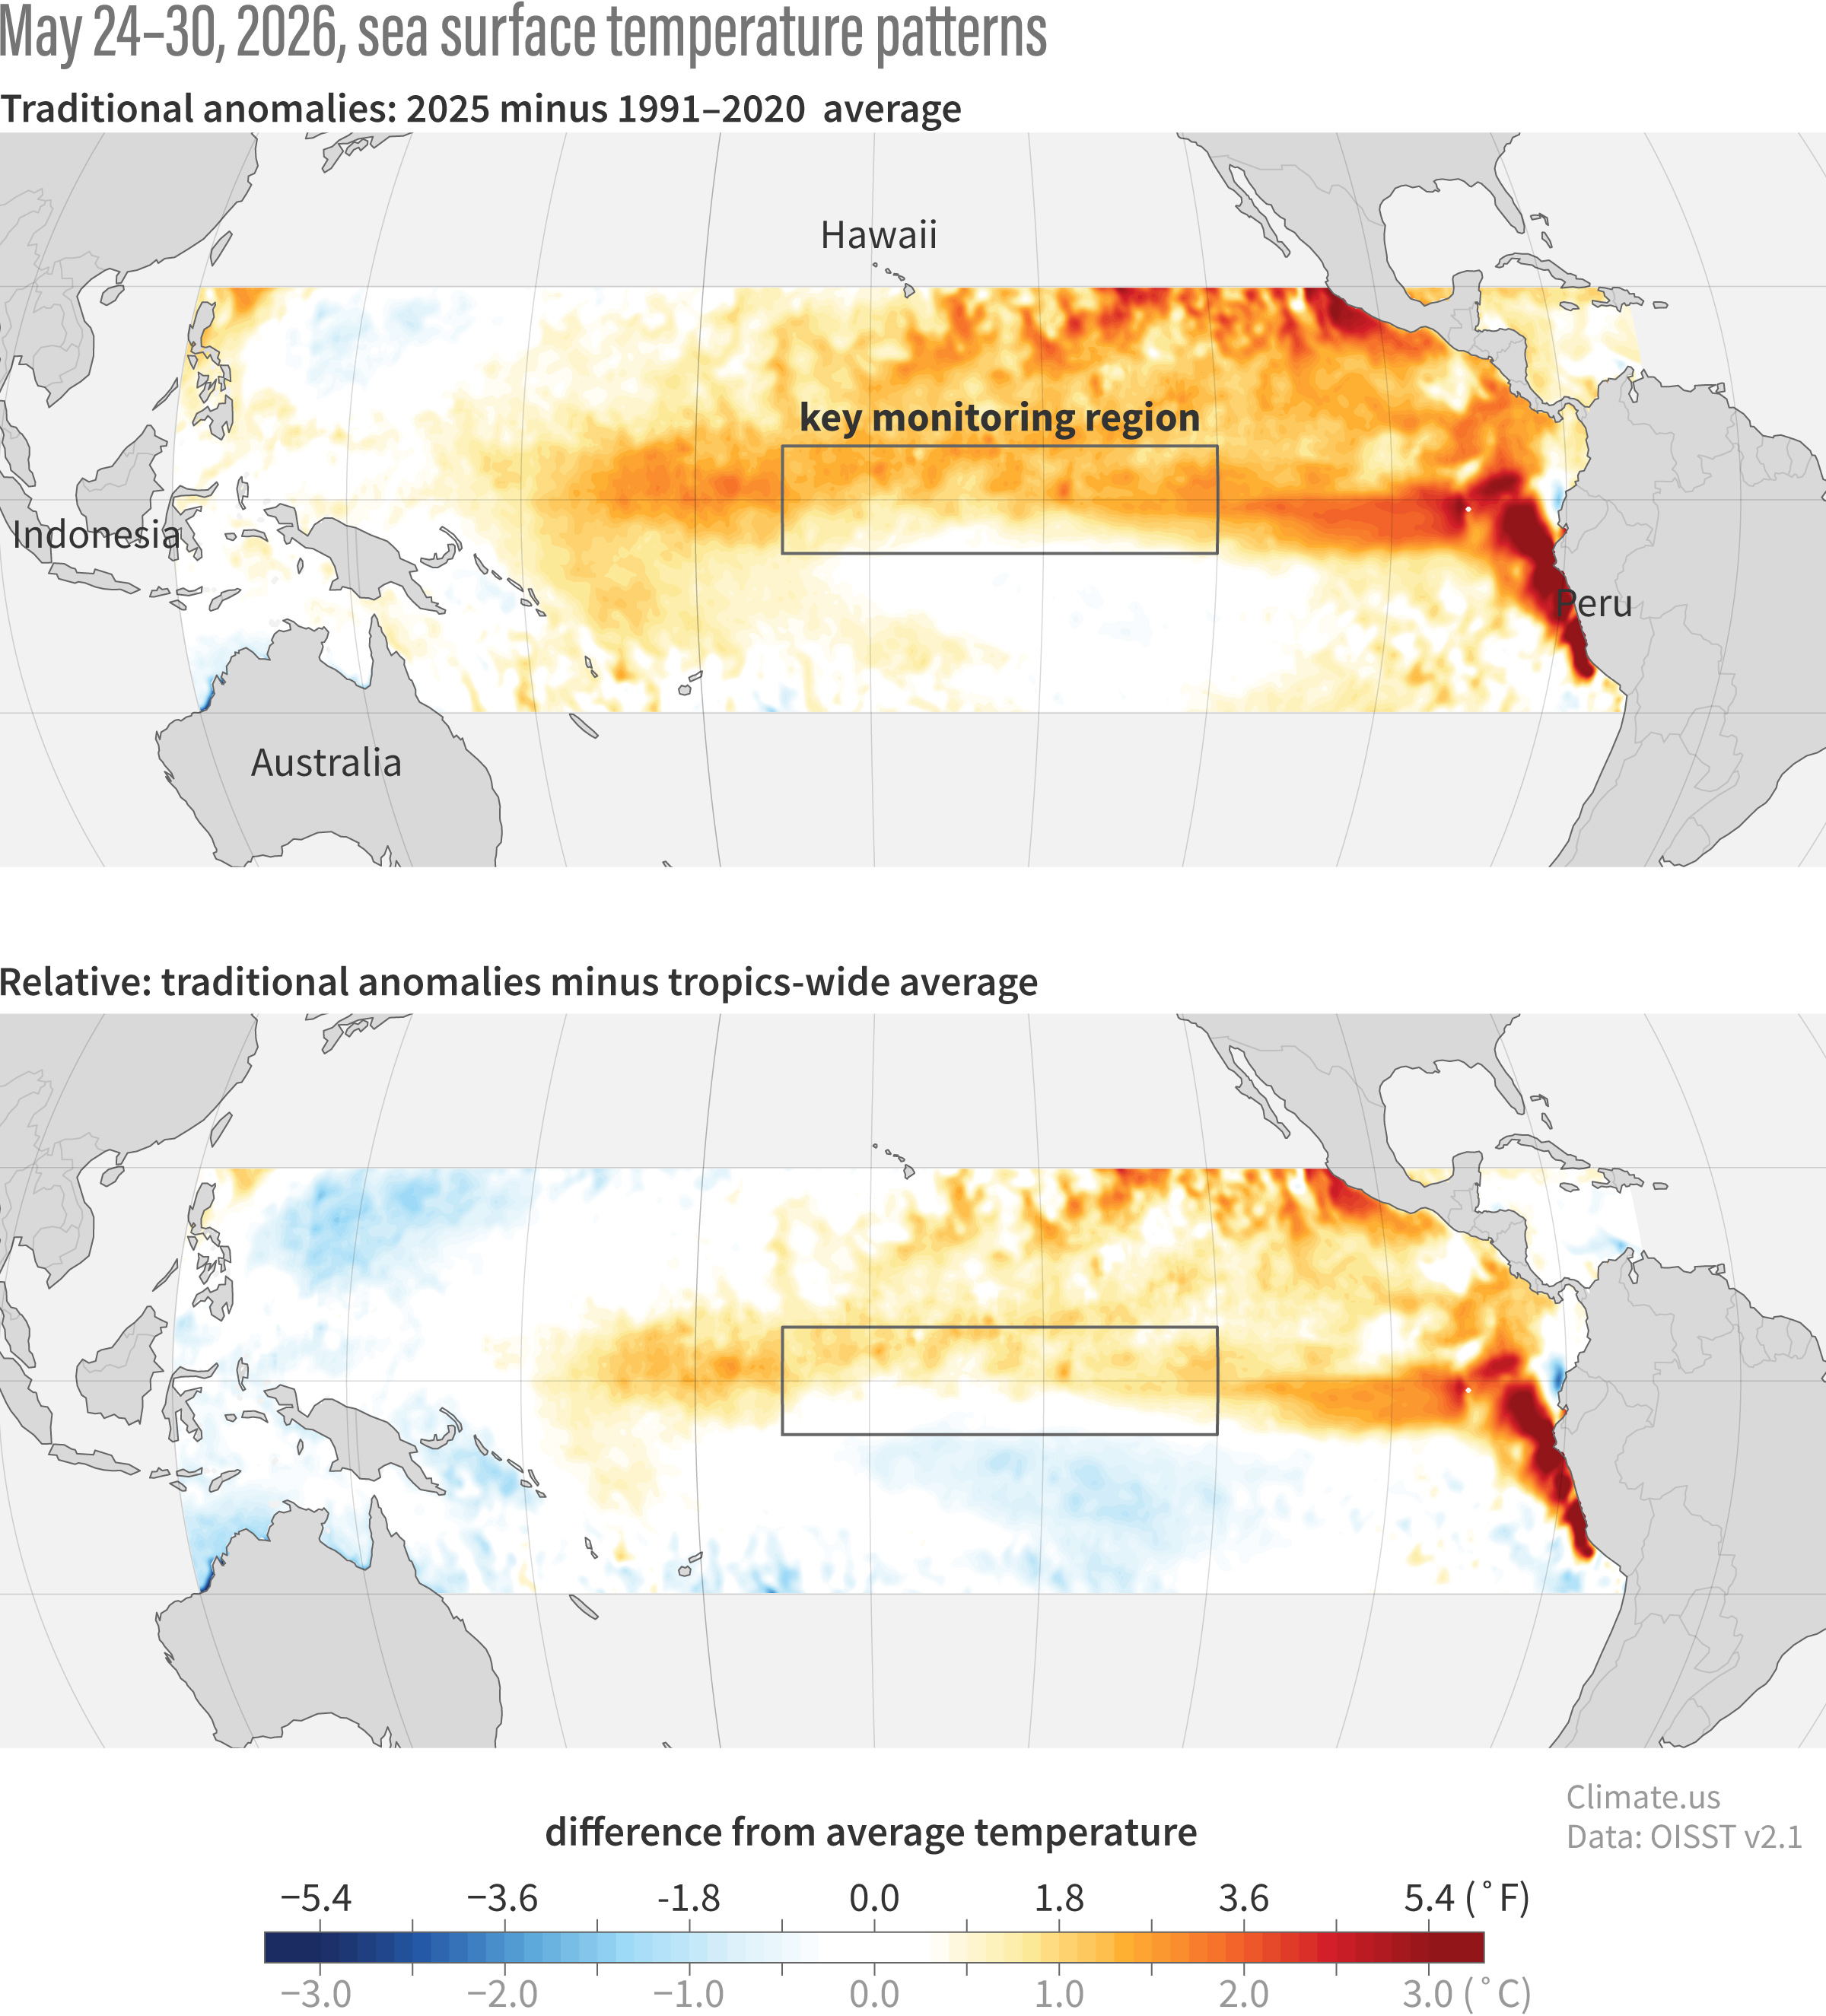
(top) A traditional anomaly, showing temperatures from May 24-30, 2025, compared to the 1991-2020 average. (bottom) A relative anomaly, showing the traditional anomaly minus the tropics-wide average. This extra step makes it more obvious that waters in the key ENSO-monitoring region were warmer than the tropical average (orange), while the water temperatures in the western Pacific were cooler than the tropical average (light blue). The relative temperature difference between one part of the tropics and another is what is most important to tropical rainfall and overall atmospheric flow. Climate.us image, based on NOAA OISST data.