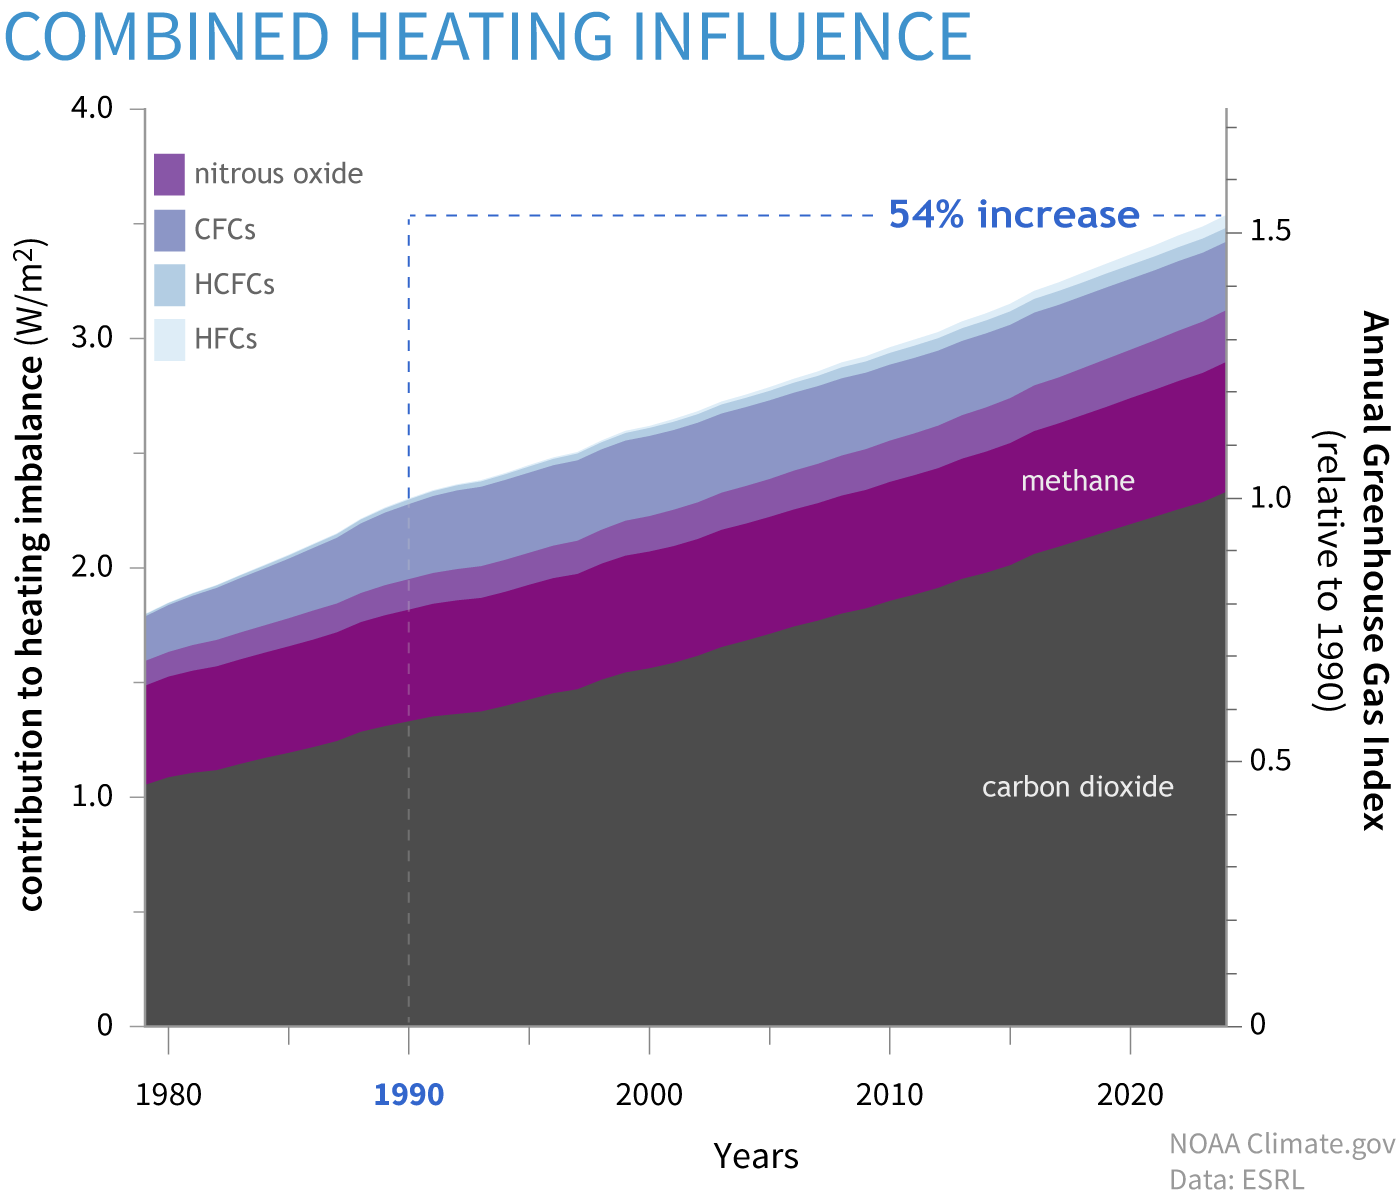
This graph shows the heating influence caused by the major human-produced greenhouse gases: carbon dioxide (gray), methane (dark purple), nitrous oxide (medium purple), chlorofluorocarbons (CFCs, lavender), hydrochlorofluorocarbons (HCFCs, blue), and hydrofluorocarbons (HFCs, light blue). Relative to conditions in 1750, today's atmosphere absorbs 3.54 extra Watts of energy per square meter of Earth's surface. For the complete list of chemicals in the CFC, HFC, and HCFC groups, see Figure 3 in the full AGGI Report. Graph by NOAA Climate.gov based on data from NOAA Global Monitoring Lab.