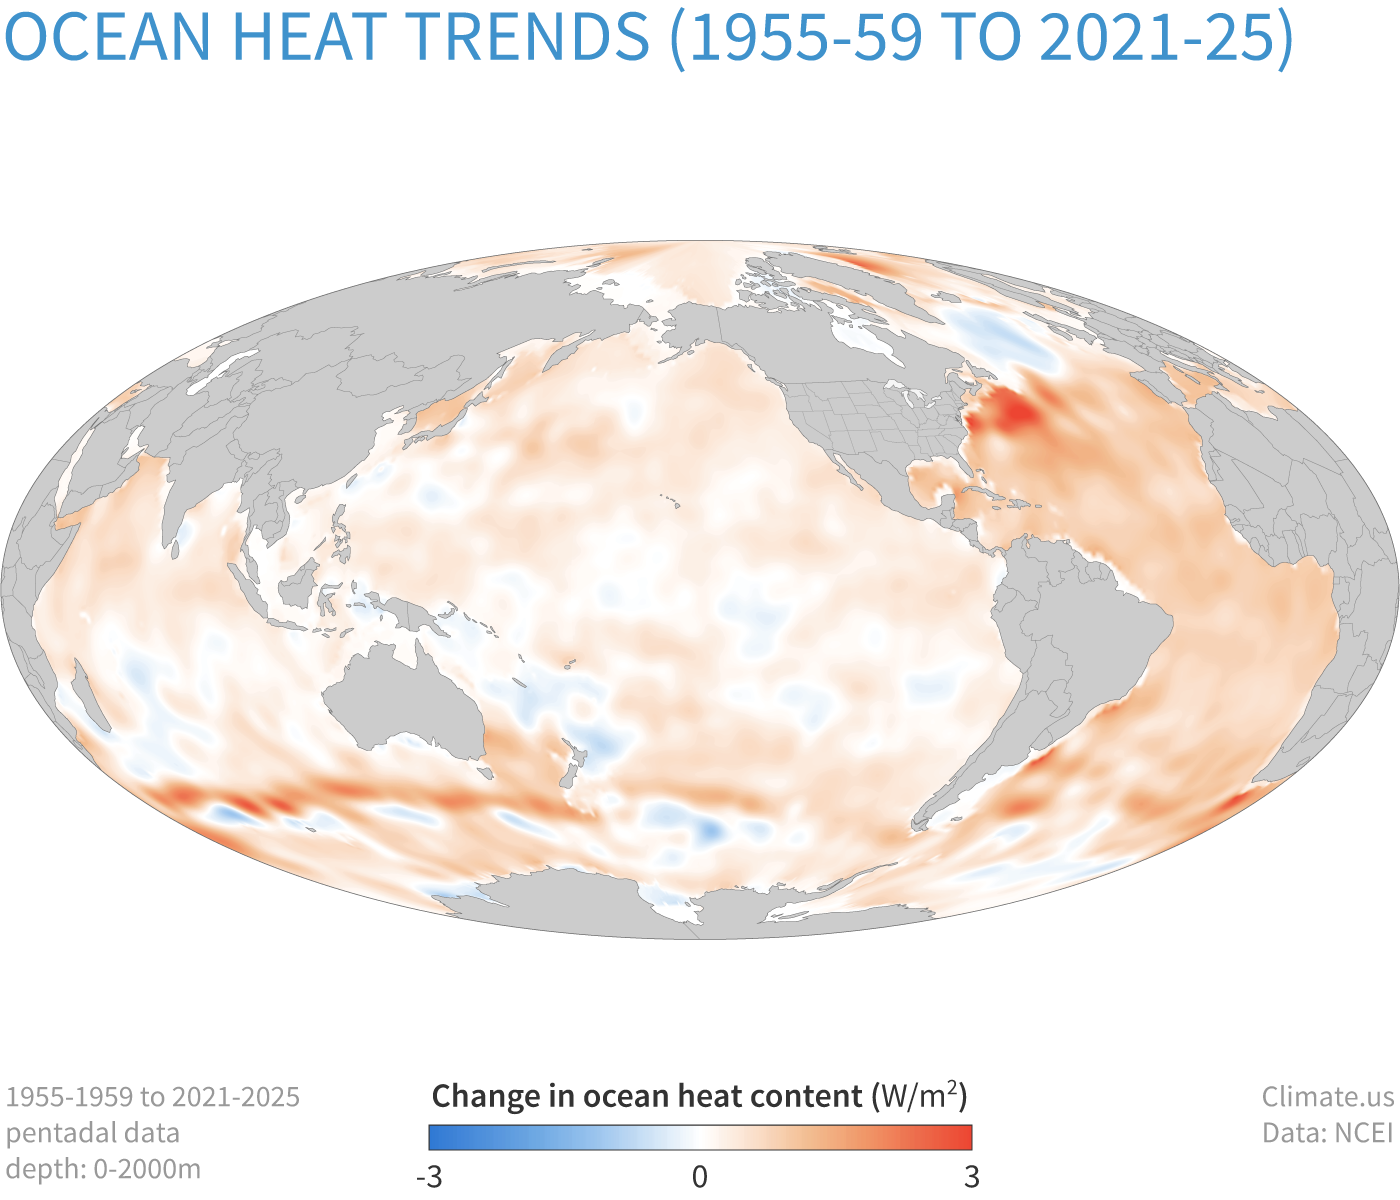
Change in stored heat content in the upper 2,000 meters (1.2 miles) of the ocean from 1955-1959 to 2021-2025 using 'pentadal' data where each yearly value is the average of a five-year window centered on that year. Darkest orange areas show where heat content increased by 3 or more watts per square meter. Some areas have lost heat (blue), but not enough to offset increases everywhere else. Climate.us image, based on NOAA Climate Data Record (CDR) data from NCEI.