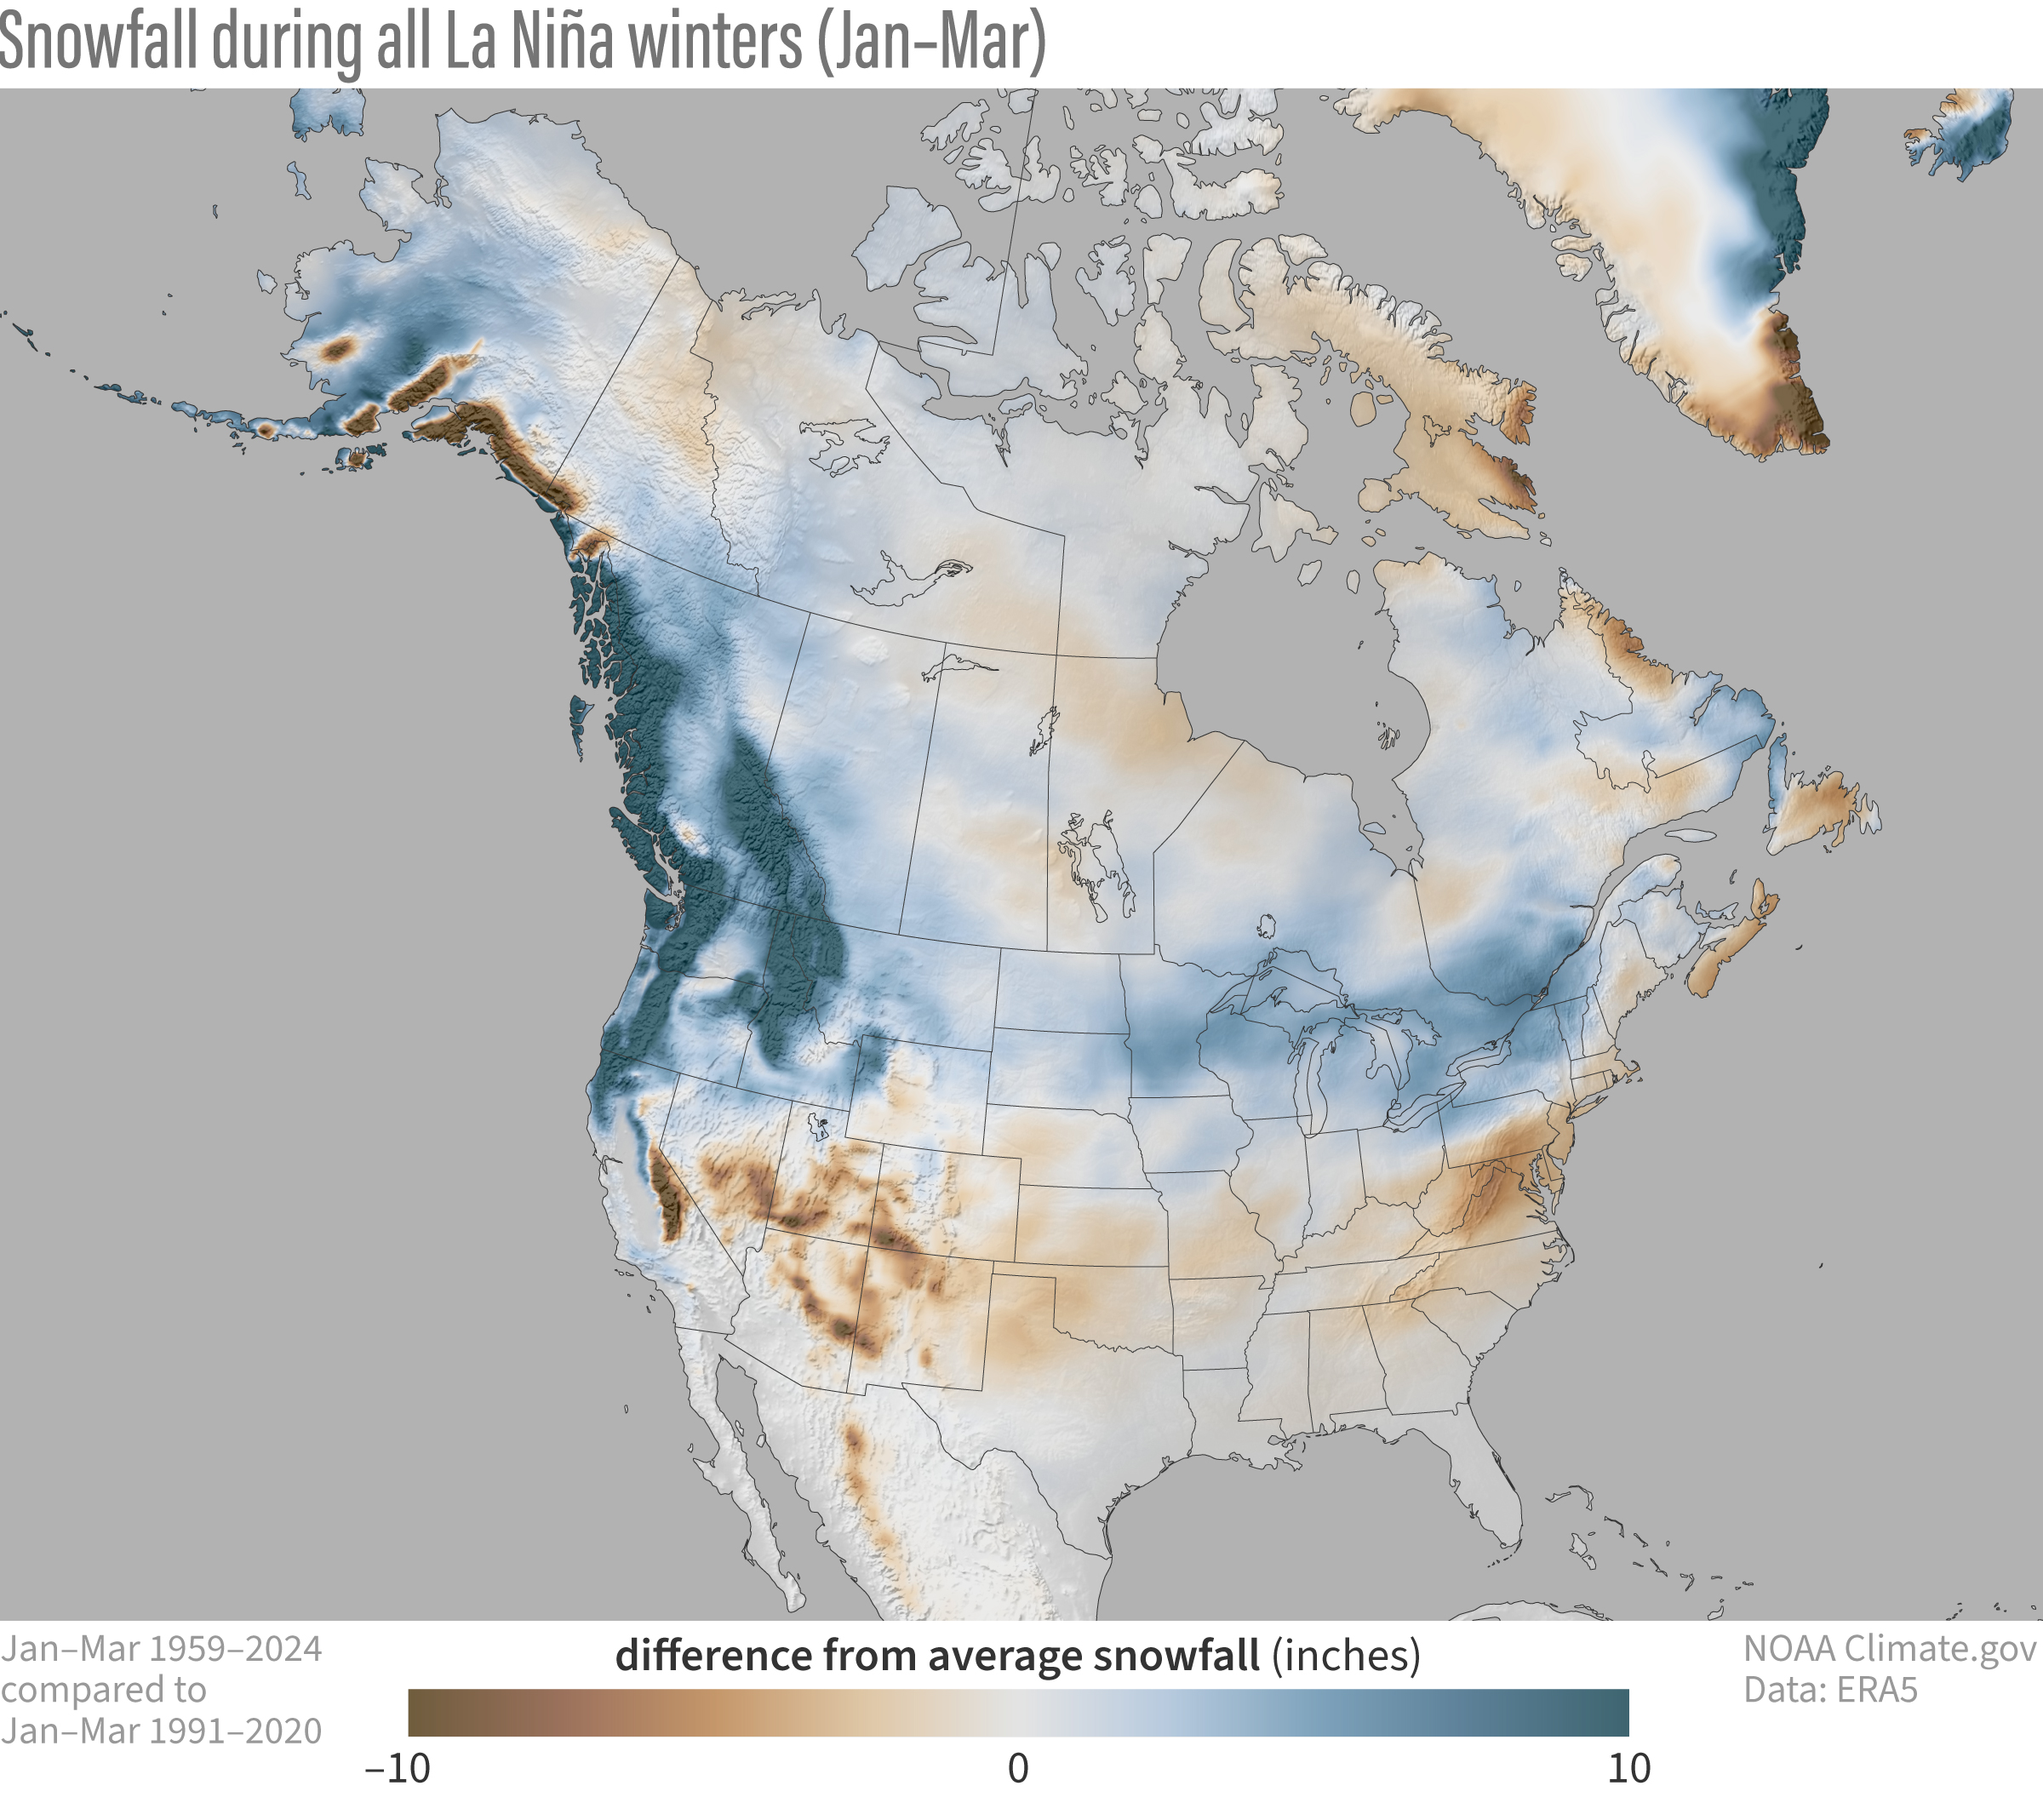
January–March snowfall compared to the 1991-2020 average for all 22 La Niña winters from 1959–2024. The long-term trend in snowfall over this period has been removed, meaning the maps technically show the average snow patterns that these La Niñas would have produced if it weren’t for long-term warming. Results for places where snow is rare should be taken with a grain of salt. NOAA Climate.gov map, based on ERA5 reanalysis data and analysis by Michelle L’Heureux.