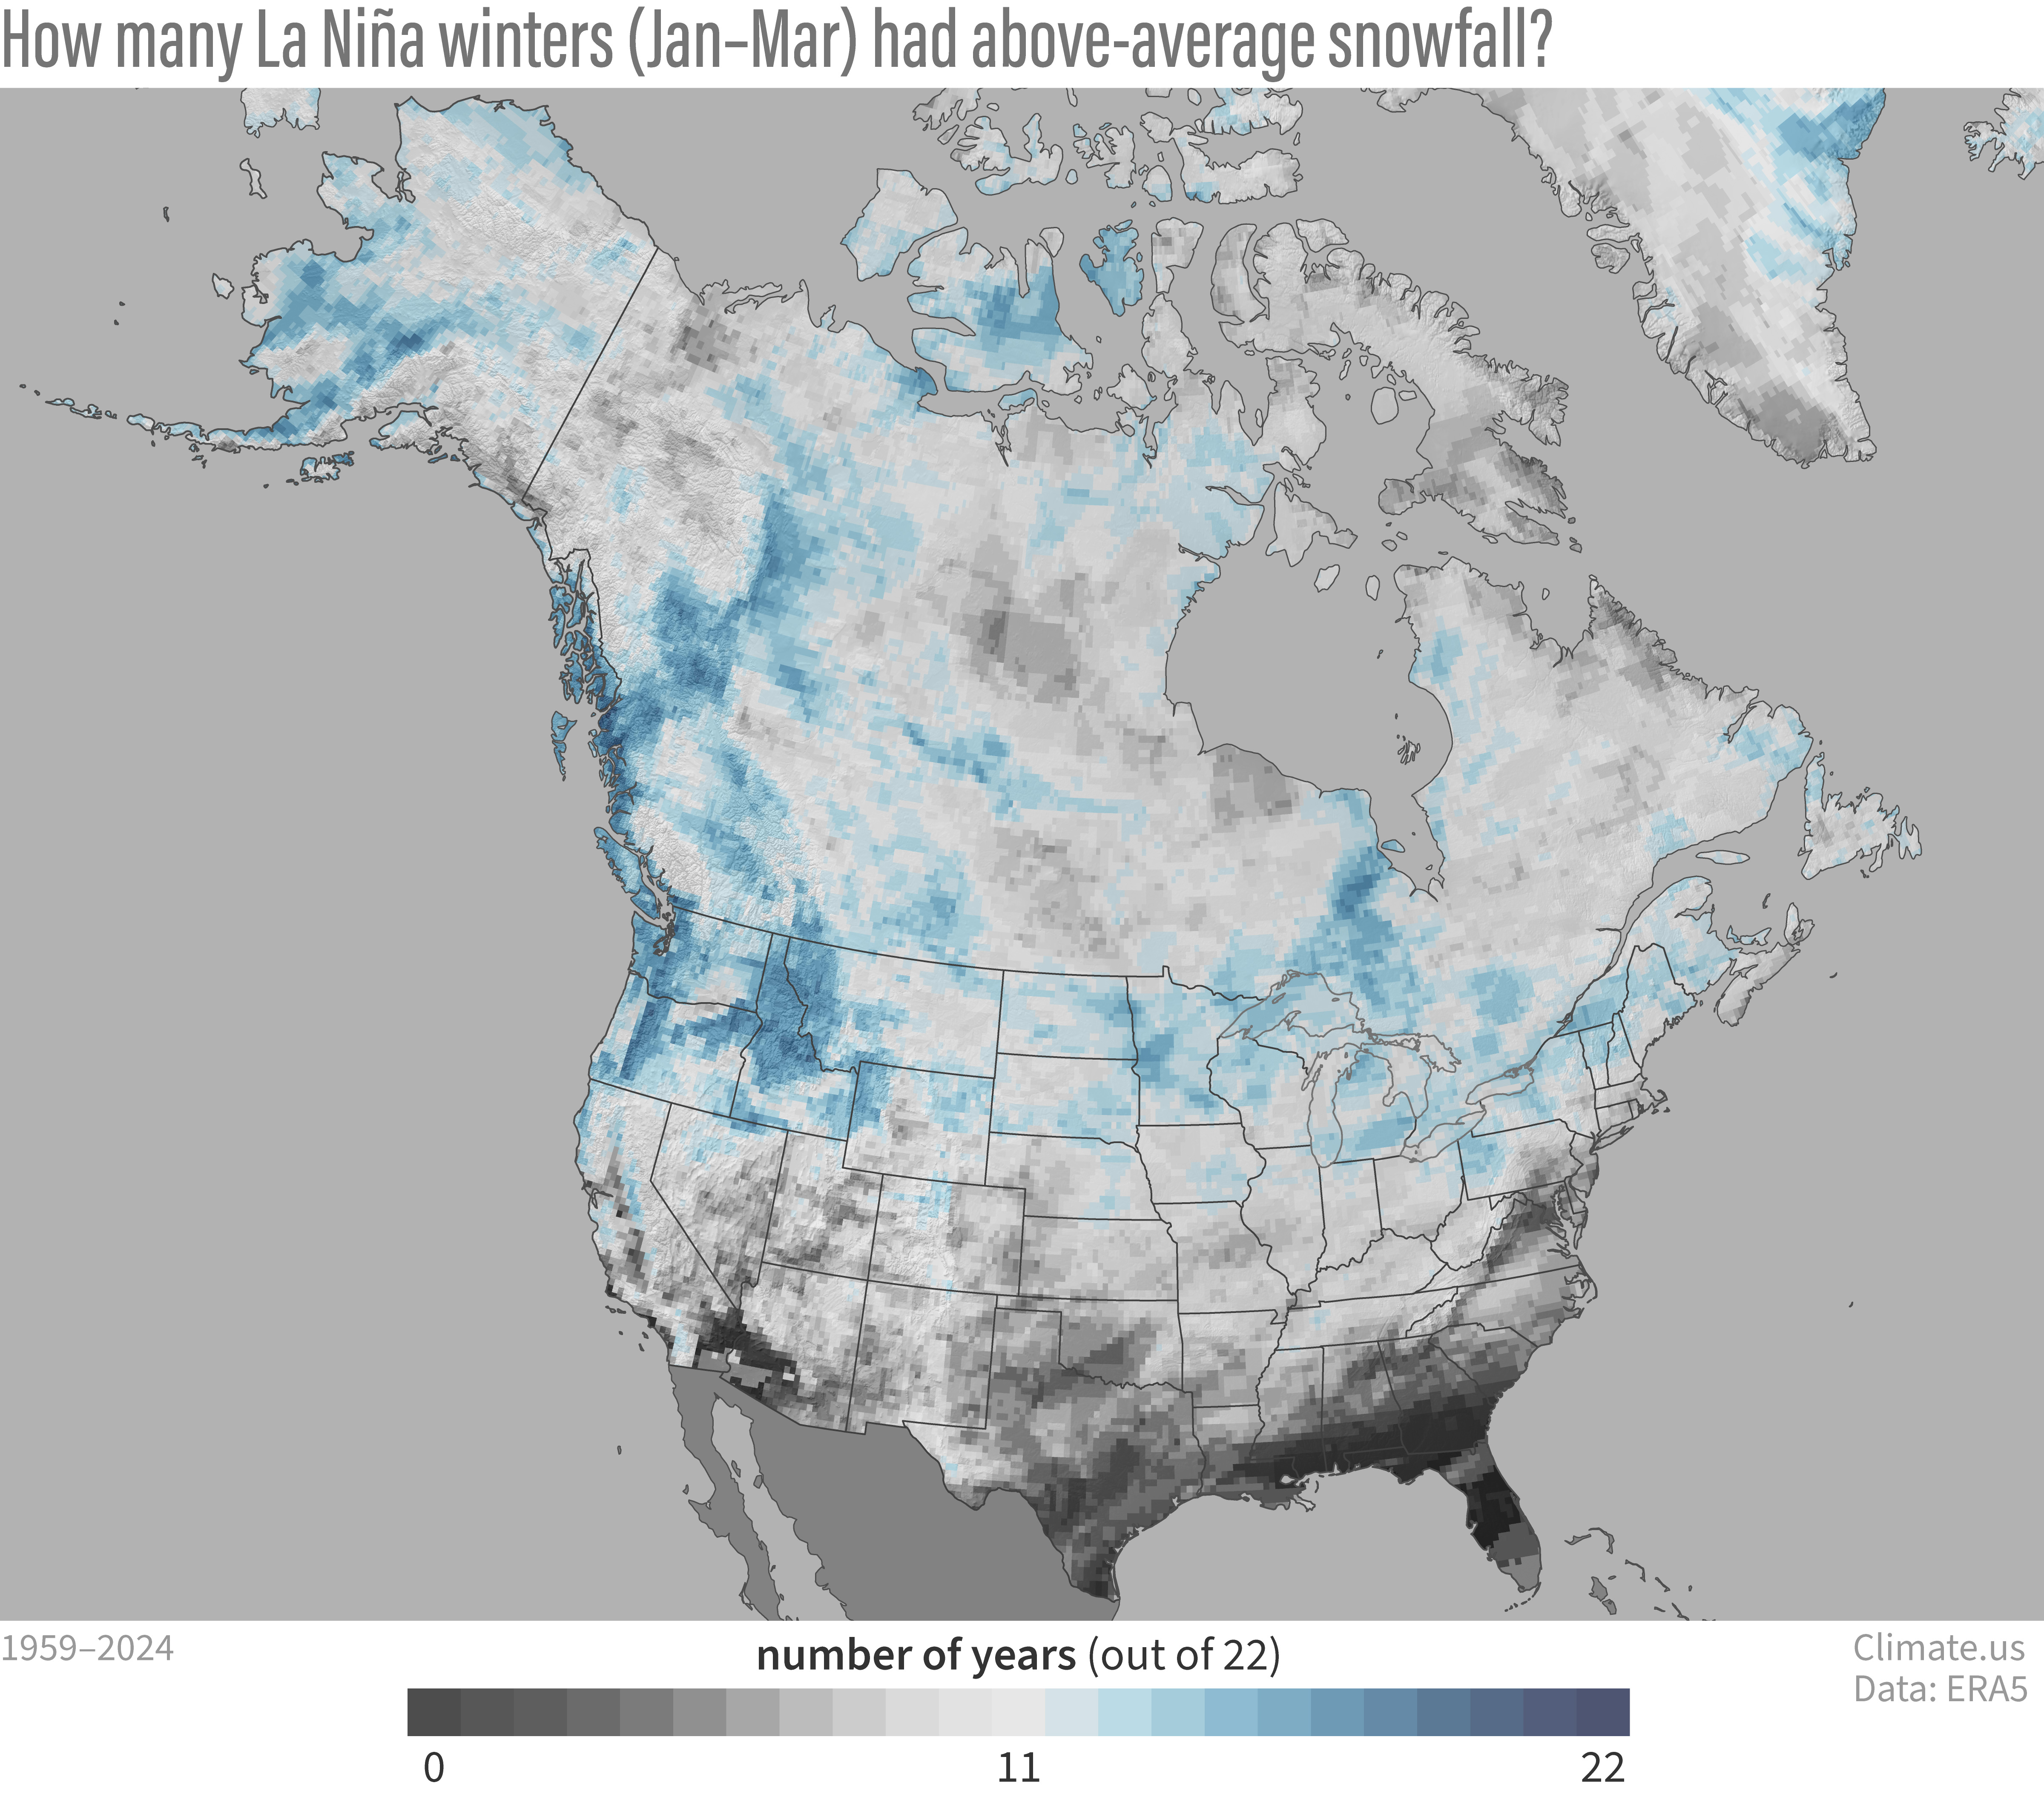
Number of winters with above-average snowfall out of 22 La Niña winters (January-March) since 1959. Blue means more than half of La Niña winters were snowier than average; the darker the blue, the higher the count. Gray means fewer than half of La Niña winters were snowier-than-average; the darker the gray, the lower the count. Map by Climate.us, using analysis of ERA5 data from 1959-2023 by Michelle L'Heureux created for Climate.gov.