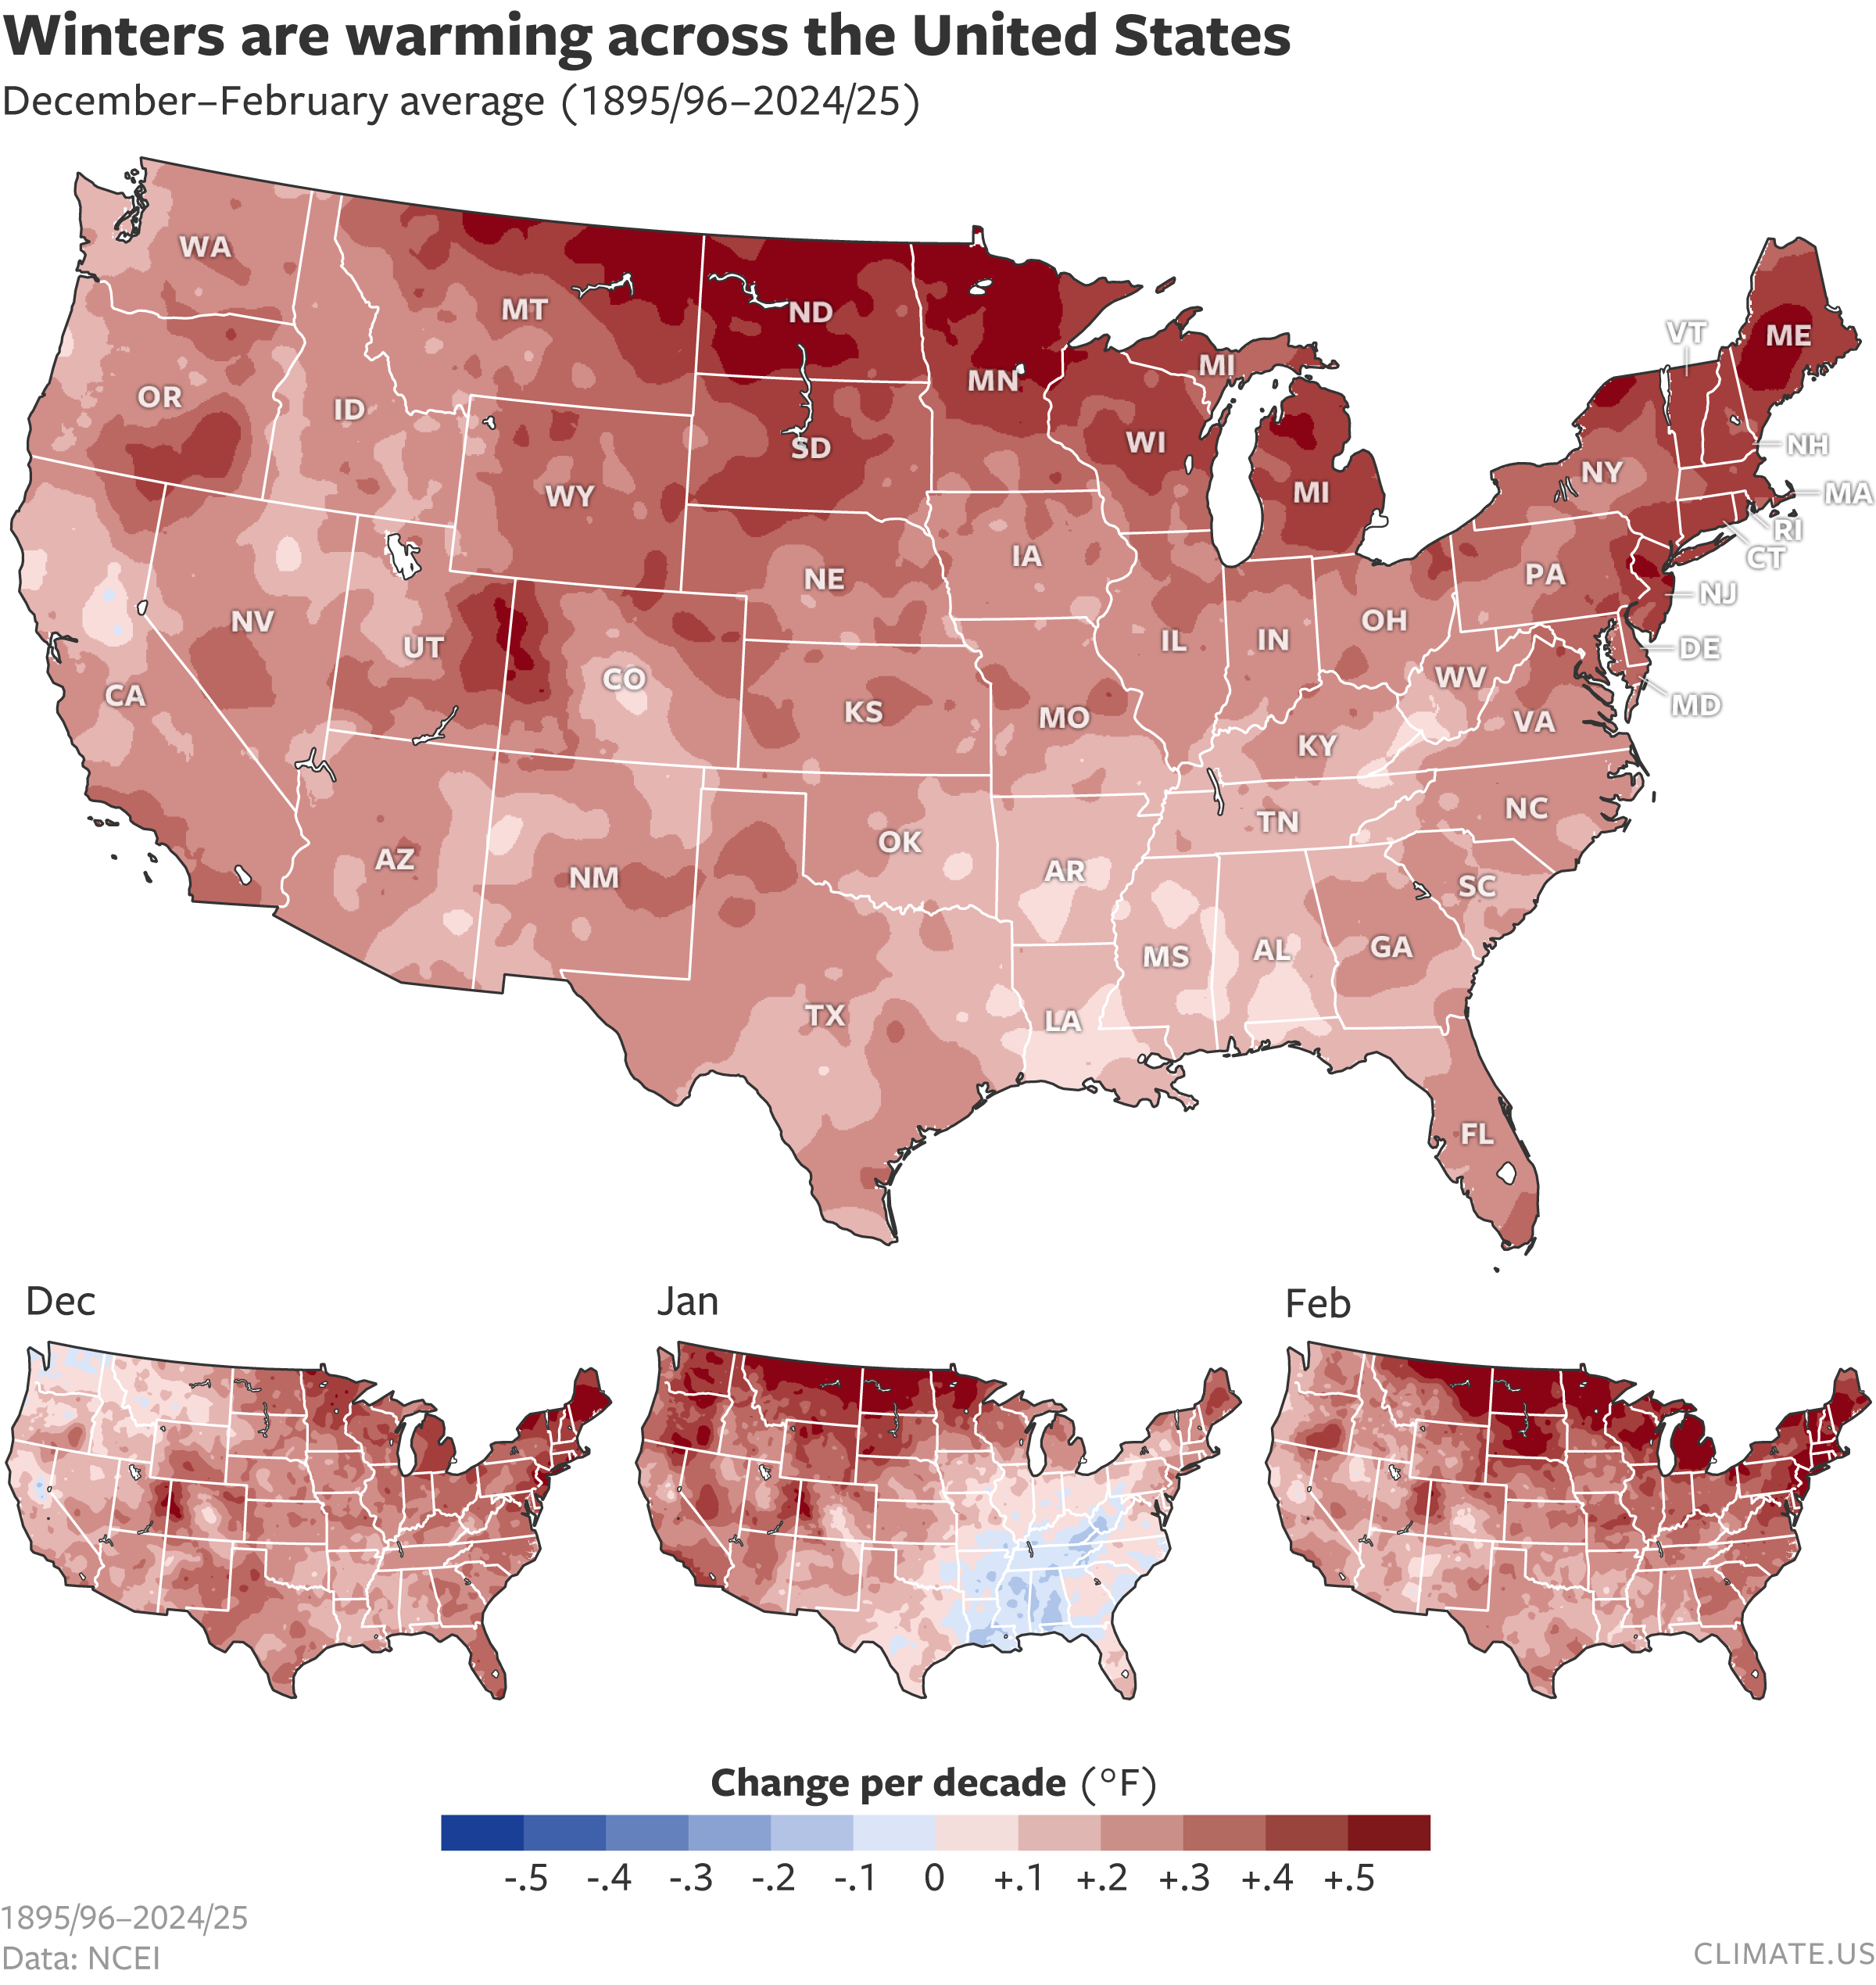
U.S. winter (December-February) temperature trends from the start of the NOAA historical record in 1895/96 through 2024/25. Areas colored red are warming; areas colored blue are cooling. In some regions—such as the January cooling trend in the South—the changes are small (not statistically significant) compared to natural variability. See NOAA versions of the maps for recent trends and statistical significance. Image by Climate.us.