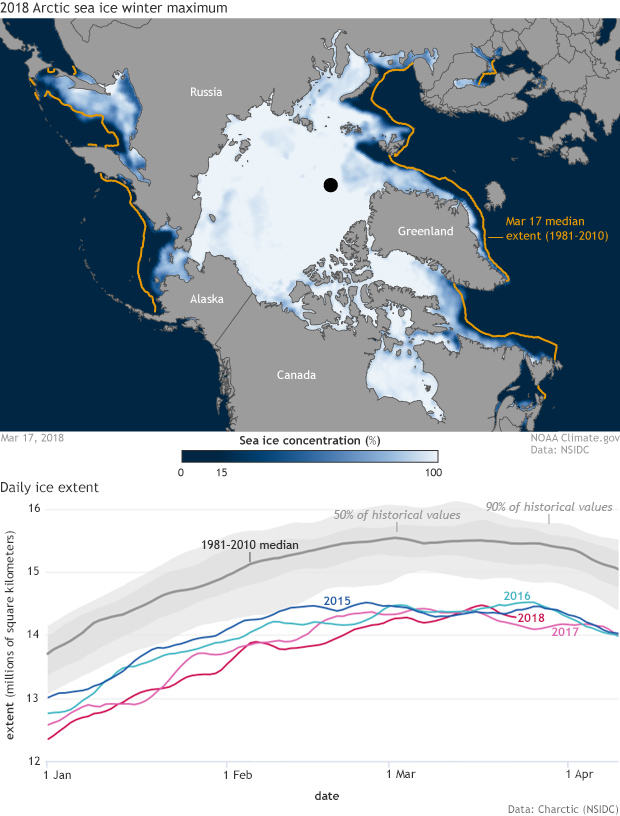
(top) Arctic sea ice concentration on March 17, 2018, compared to the 1981-2010 median (gold line). The graph shows daily ice extent from January-April each year. Image by NOAA Climate.gov, based on data from the National Snow and Ice Data Center.
(top) Arctic sea ice concentration on March 17, 2018, compared to the 1981-2010 median (gold line). The graph shows daily ice extent from January-April each year. Image by NOAA Climate.gov, based on data from the National Snow and Ice Data Center.