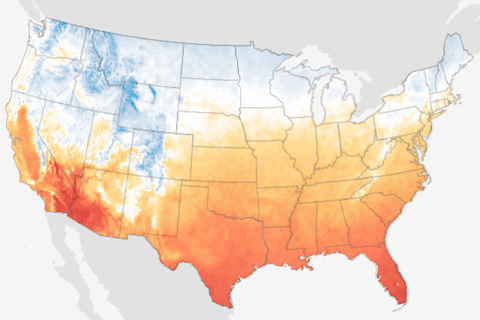
This animated gif shows how October average temperatures in the contiguous United States are projected to change in coming decades if global carbon dioxide emissions continue along a high-emissions pathway.
This animated gif shows how October average temperatures in the contiguous United States are projected to change in coming decades if global carbon dioxide emissions continue along a high-emissions pathway.
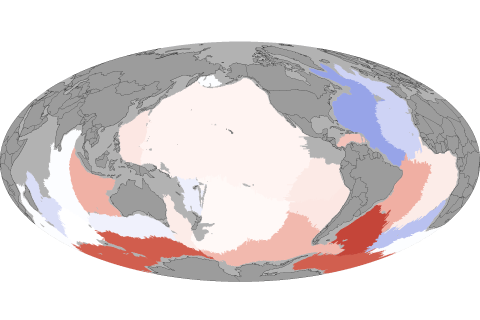
Earth's coldest waters are warming, an indication that global warming has reached one of the most remote corners of the ocean's circulatory system.
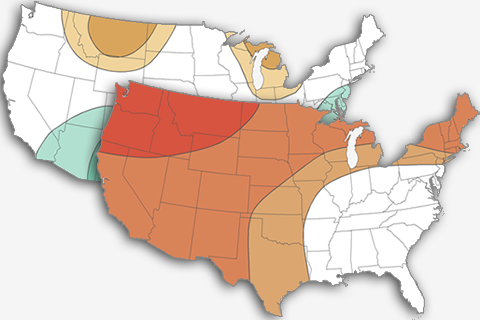
How might a developing El Niño influence conditions over the U.S. this winter? The Climate Prediction Center’s Mike Halpert gives us the details as he discusses NOAA’s 2018-19 winter outlook.
Climate Prediction Center meteorologist Mike Halpert explains the outlook for temperature, precipitation, and drought in the United States for December 2018-February 2019.
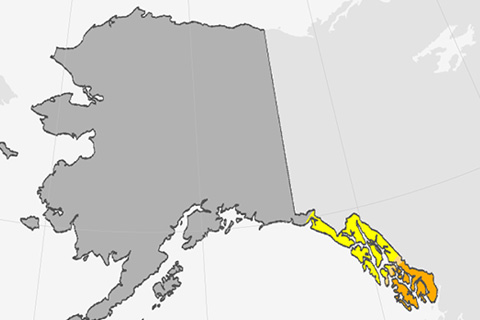
Drought, warmth, and a towering ridge of high pressure make an unusual start to fall in Alaska.
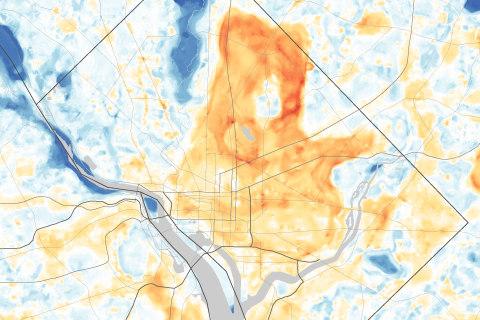
Use a slider to compare satellite images of Washington, DC, and Baltimore, MD, with maps of afternoon temperatures to see the hottest and coolest parts of the city on a late summer day.
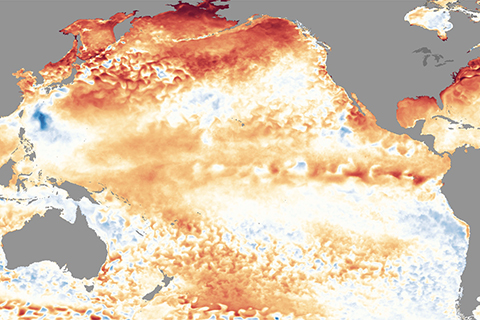
We’re still in neutral, but El Niño conditions may be on the horizon. What’s happening in the tropical Pacific?
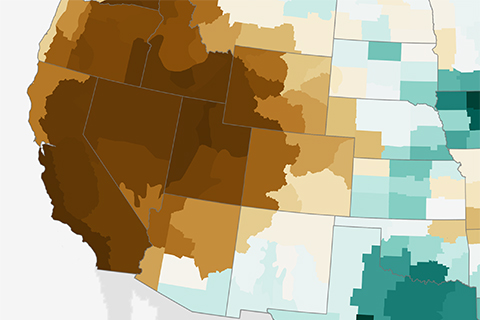
The 2017-2018 water year came to a dry end in California at the end of September, a year after wet conditions alleviated drought.
From heat waves to heavy rain, the National Climate Assessment's recently updated collection of indicators shows how climate is changing.
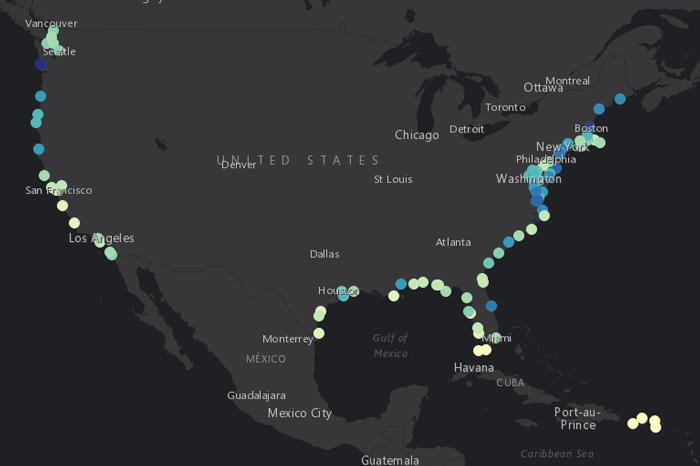
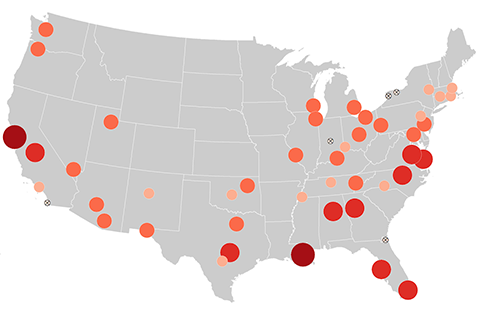
Costly and inconvenient, high-tide flooding of coastal communities is on the rise. Thanks to higher water levels from El Niño and sea level rise, the number of high-tide flood days in 2018 is projected to be 60% higher this year than would have been common around 2000. Find out what's predicted for your city in this interactive map.