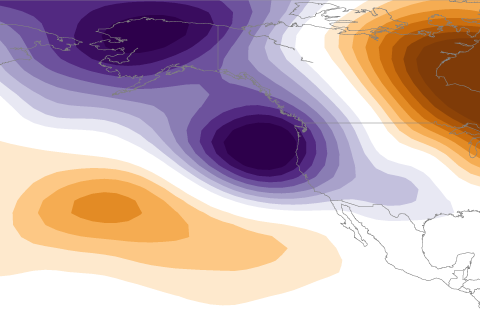
La Niña usually means a drier than average water year for California. So what happened in 2016-2017 when a weak La Niña coincided with a remarkably wet water year?
La Niña usually means a drier than average water year for California. So what happened in 2016-2017 when a weak La Niña coincided with a remarkably wet water year?
Have you ever wondered what the biggest, hottest, coldest or deepest weather records were for your state? So have many people. These data are interesting on the surface, but going Beyond the Data, they also help us think about resiliency in the face of weather, or climate or climate change, or some combination of the above.
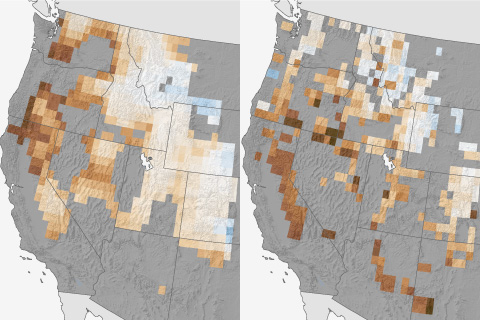
Test runs of experimental models for predicting winter snowpack show some success in many mountain ranges in the western United States.
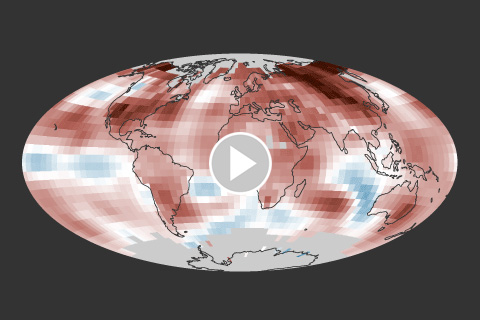
The 2017 average temperature was the third highest since 1880, behind 2016 (warmest) and 2015 (second warmest).
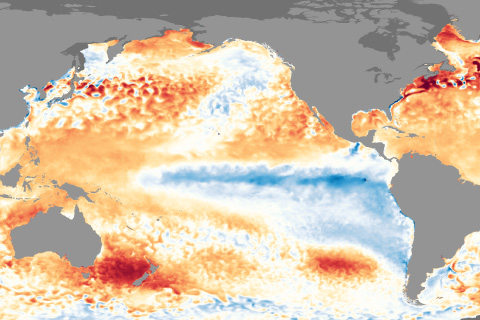
La Nina conditions appear to have peaked in strength and will likely last through the upcoming winter.
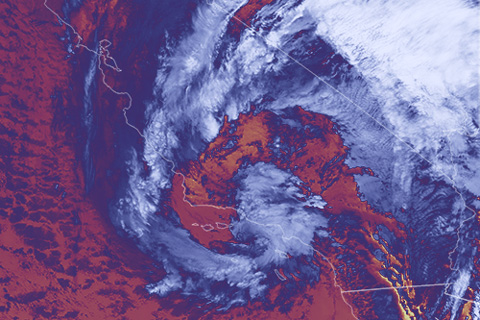
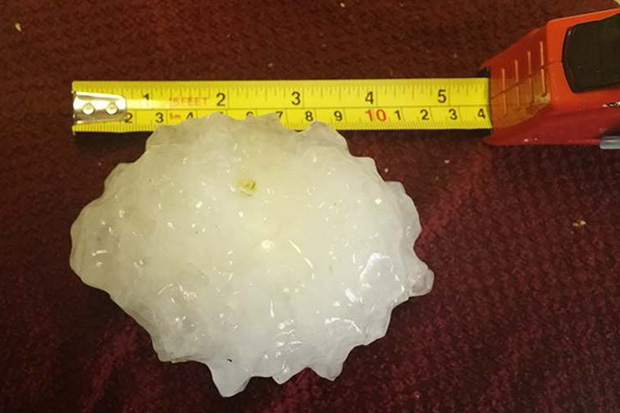
Early estimates suggest precipitation in the past 7 days was up to 400% of normal in parts of southern California. In hilly terrain scorched by wildfires in December 2017, the heavy January rains led to deadly mudslides.
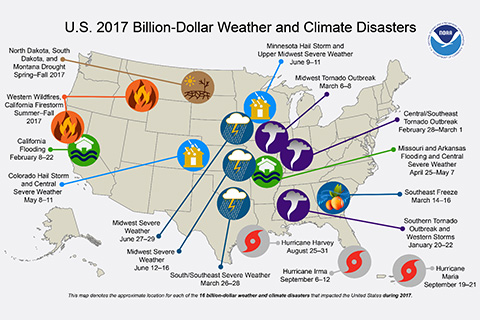
Counting the California wildfires as a single event, the U.S. experienced 16 weather or climate disasters costing at least $1 billion dollars, tying the year with 2011. Total estimated cost was a record-setting $306.2 billion.
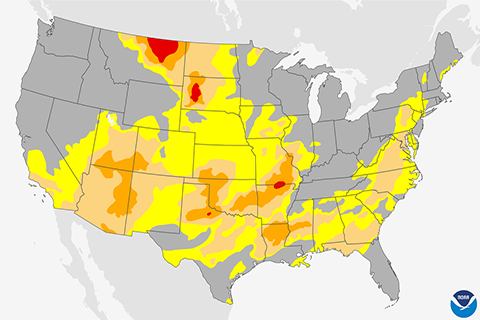
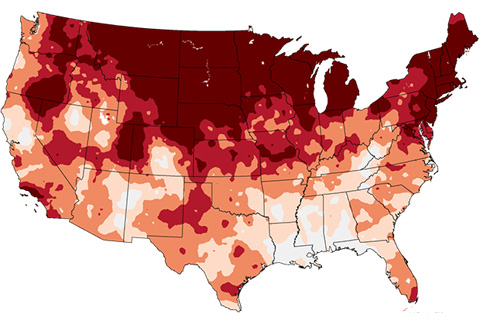
Drought has deepened over the southwestern United States which has delayed the arrival of snow and start of winter for parts of Arizona.
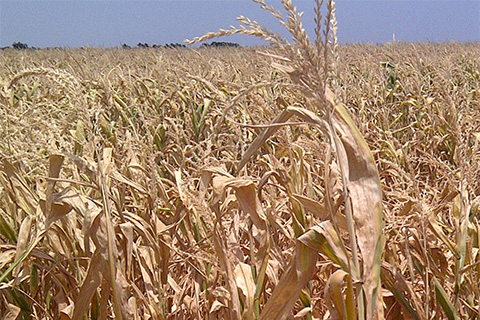
Drought is about more than lack of rainfall. A new tool keeps track of another major player: how thirsty the atmosphere is.
Our climate is changing. To help our users see how different times and places are warming at different rates, NCEI has created a new series of trend maps for the contiguous U.S. In this blog, NCEI's Jake Crouch gives us a show and tell featuring the new maps.