News & Features
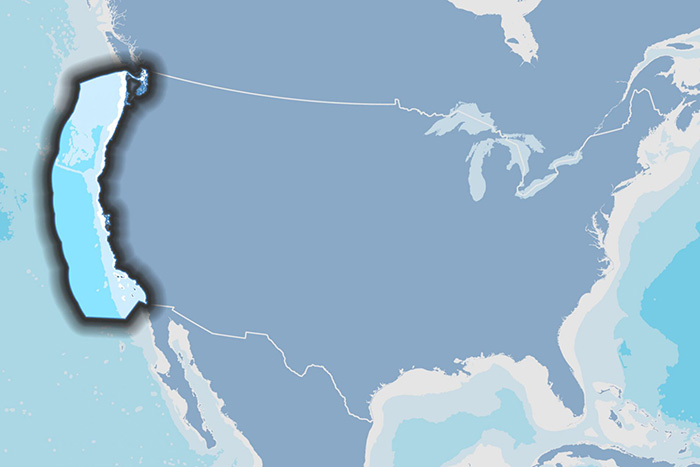
California Current forecasts tend to remain reliable longer when they better represent key atmospheric drivers such sea level pressure and the Pacific meridional mode.

Studies have shown a significant shift in the distribution of sea surface temperatures due to climate change, with serious implications for marine ecosystems. Scientists must now distinguish between extreme marine heatwave conditions derived from long-term historical data and extremes that account for the new, higher average temperatures.
Science teacher Spencer Cody and his students live in rural South Dakota, a place Cody describes as a “pole of inaccessibility.” Geographically isolated from the ocean by 1,000 miles in every…
Back to school is looking quite different this year, but NOAA is still your trusted source for ocean, Great Lakes, weather, and climate education. We know teachers have been working extra hard to…
Teachers: Join NOAA and partners for Stay-In-stitute for Climate Change Education Virtual Conference
From July 22-24, 2020, the three-day training will provide educators with skills, tools and resources to teach climate change concepts and empower students in all subject areas.
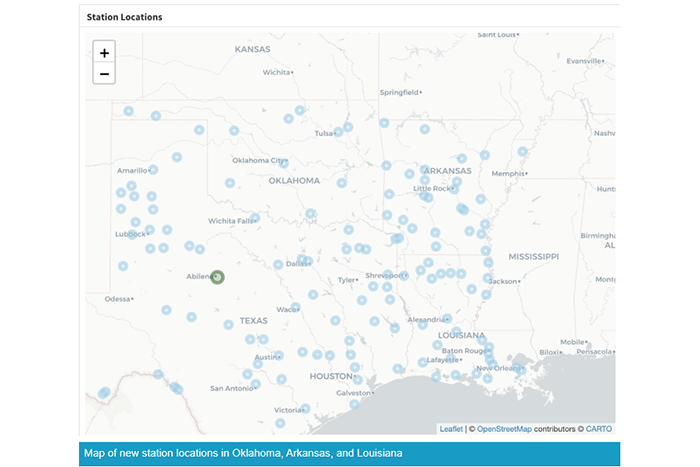
The Texas Temperature Trends Dashboard, has been renamed and updated to include weather stations in Arkansas, Louisiana, and Oklahoma. Anyone can access the dashboard through a web browser.

A researcher with the western Climate Adaptation Partnerships team California Nevada Adaptations Program has drawn on existing literature to develop 10 key tasks of communication amidst coastal relocation.
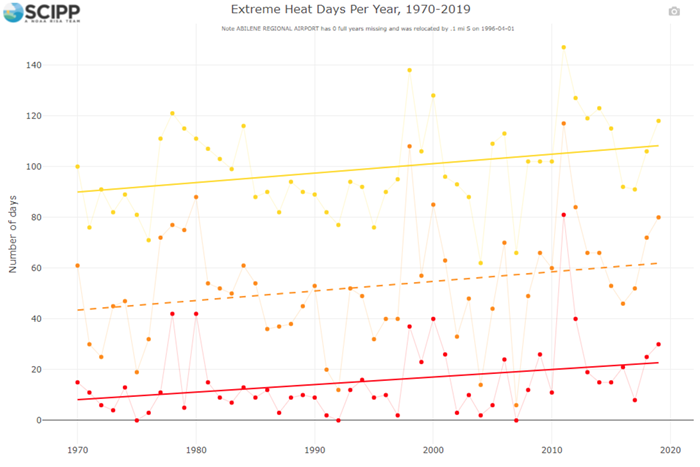
In May 2021, the Southern Climate Impacts Planning Program (SCIPP), a NOAA Regional Integrated Sciences and Assessments (RISA) team, in collaboration with Texas Sea Grant, released a new dashboard that shows historical trends in temperatures for locations across the state of Texas. The new dashboard offers location-specific information about changes in temperature in the last 50 years.