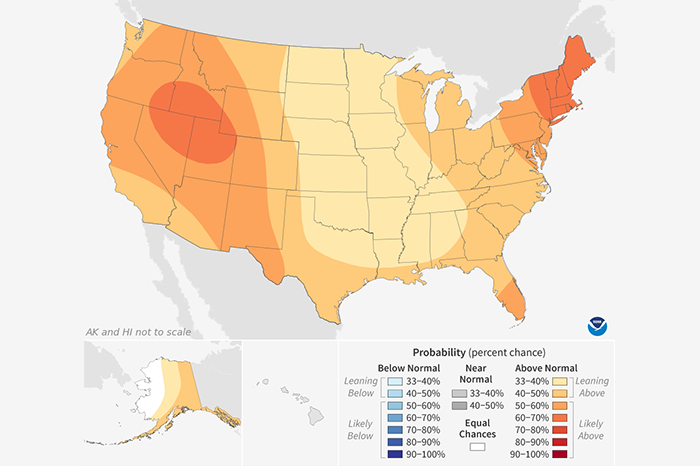
Shaded areas show where average temperature has an increased chance of being warmer or cooler than usual. The darker the shading, the greater the chance for the indicated condition. White areas have…
Shaded areas show where average temperature has an increased chance of being warmer or cooler than usual. The darker the shading, the greater the chance for the indicated condition. White areas have…
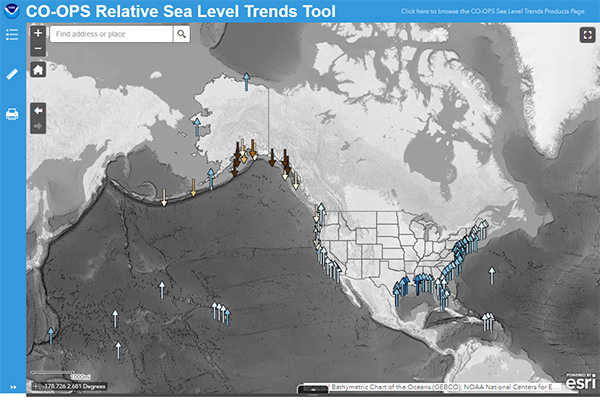
Case studies and examples of how citizens use climate data.

You can use a number of software packages and Web sites to to access or generate image maps or graphs of historical climate data or future climate projections.
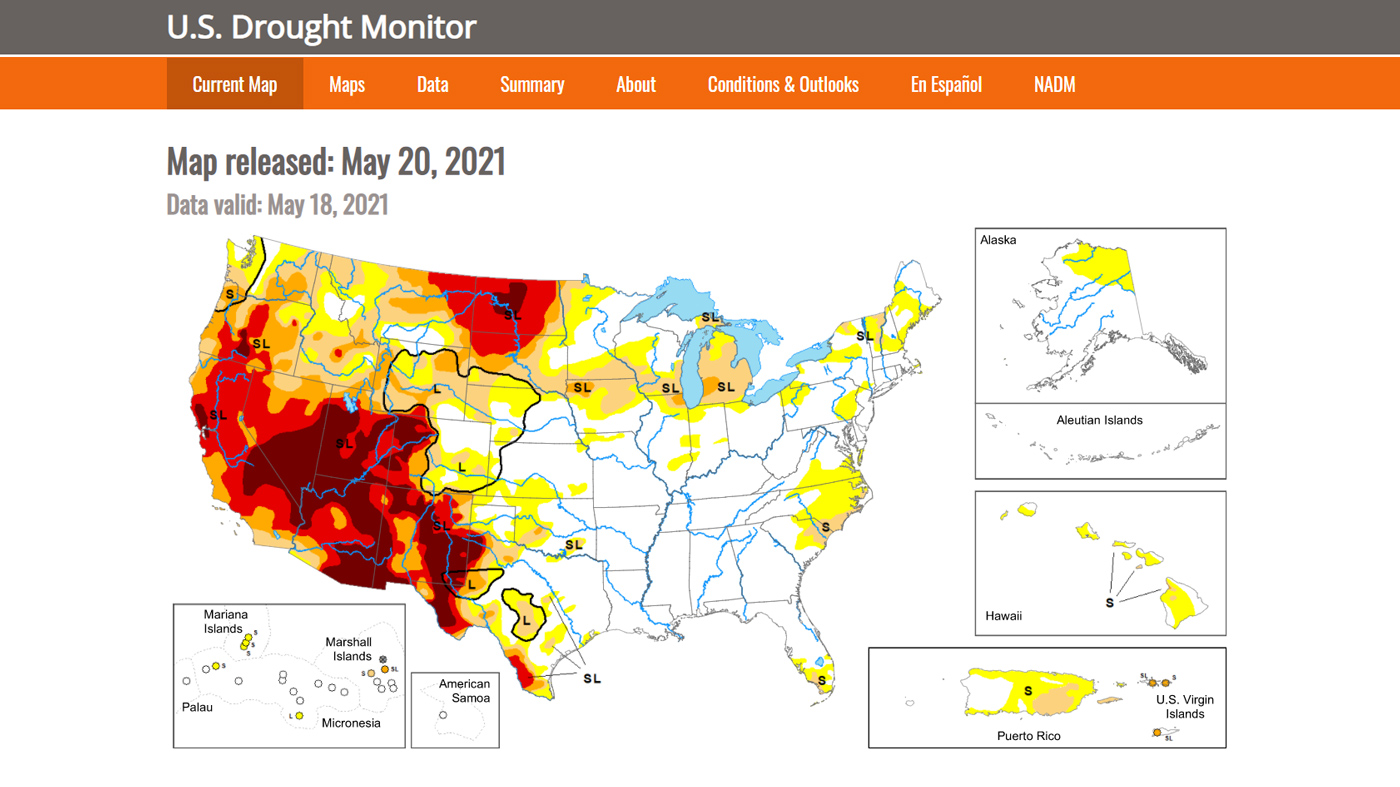
A weekly map—updated each Thursday—that shows the location and intensity of areas currently experiencing abnormal dryness or drought across the United States.

The short-term state of the atmosphere is weather. Climate is a description of the long-term pattern of weather conditions.
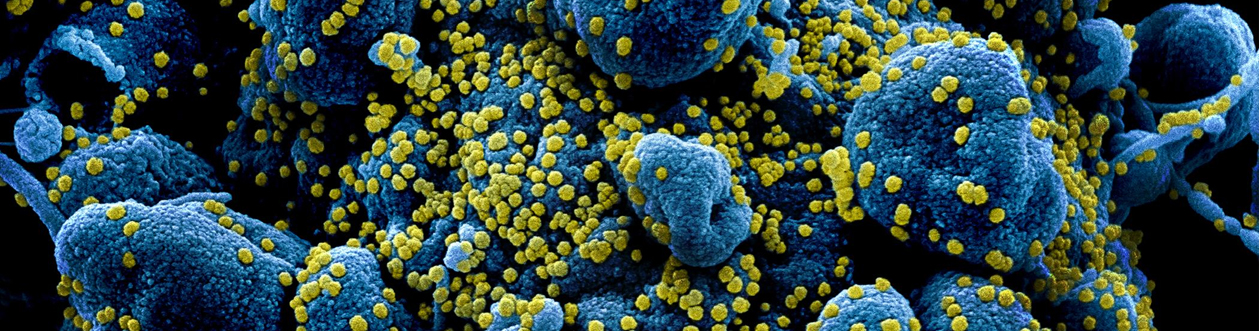
Essential climate & weather variables for use in epidemic modeling studies
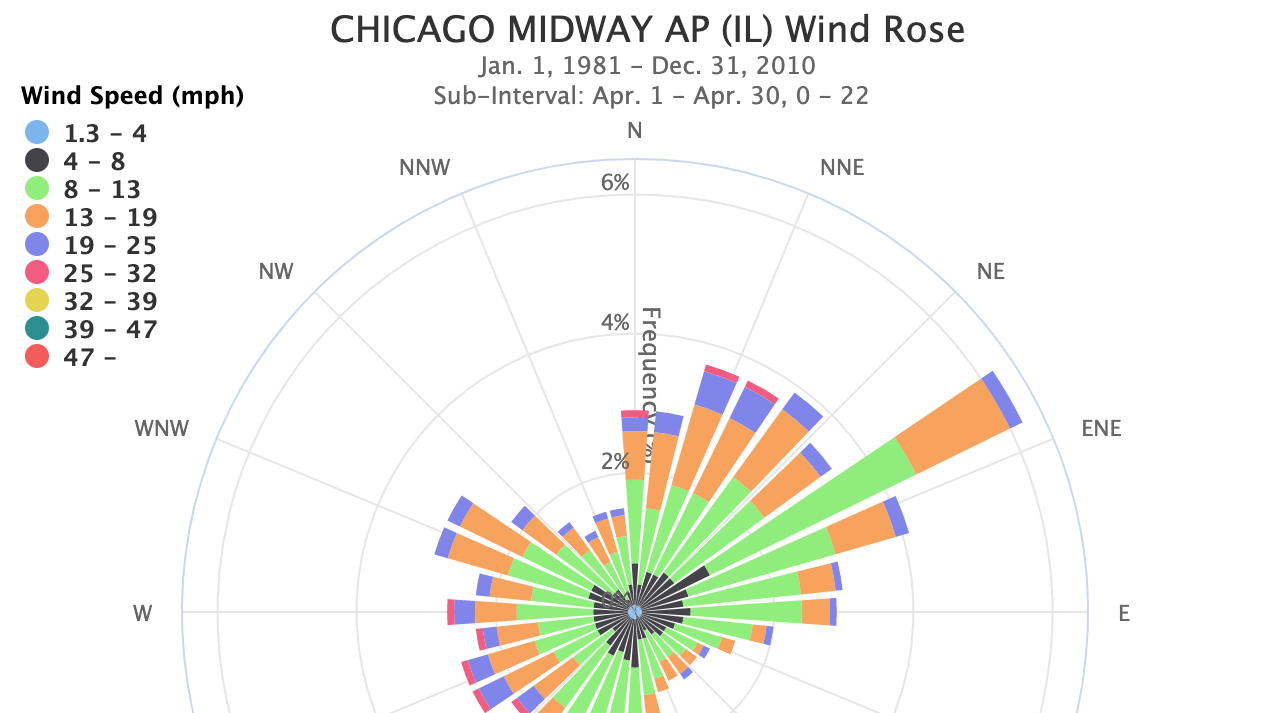
Wondering which direction the wind was from during your last cold snap, or which summer months usually have a breeze?
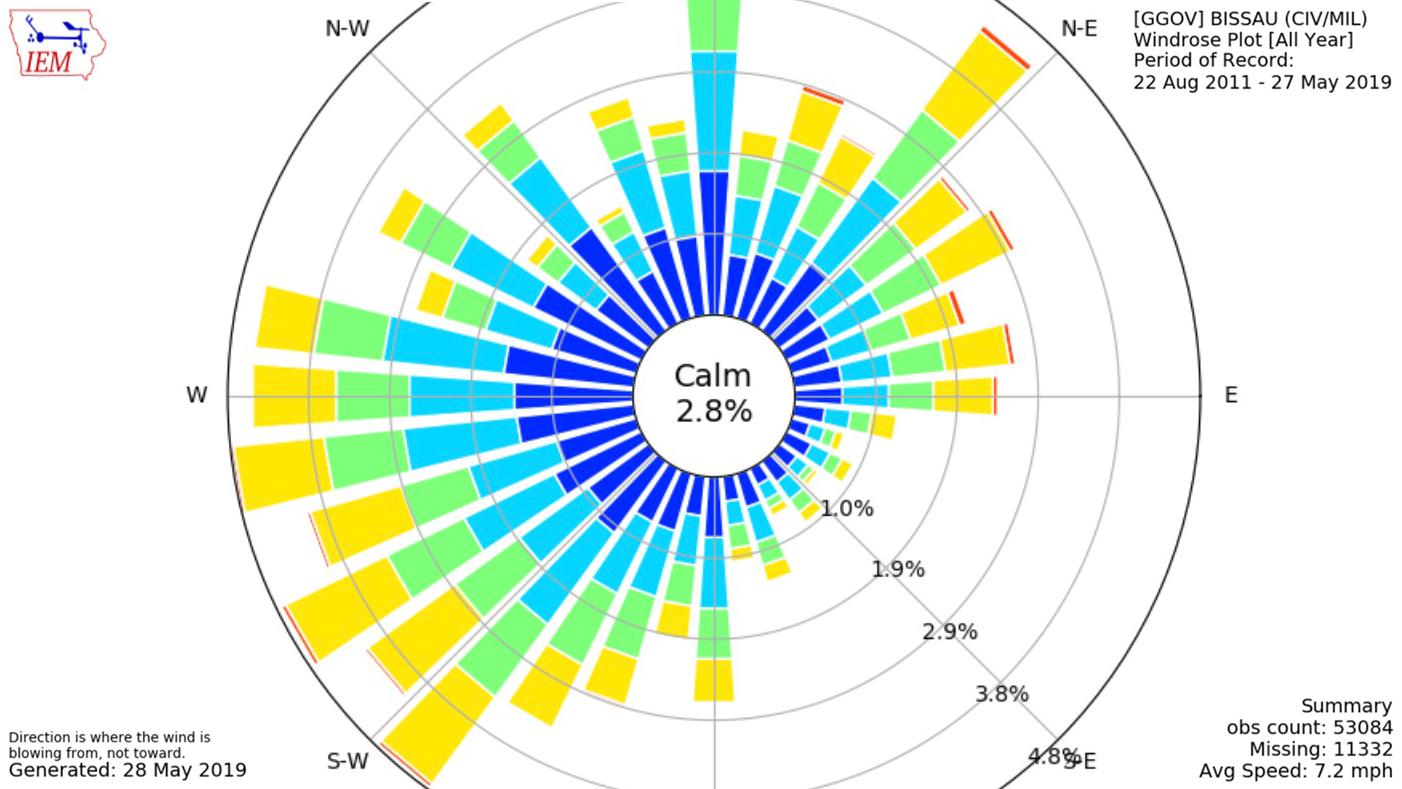
The Iowa Environmental Mesonet (IEM) lets you examine long-term records of wind speed and direction for many locations around the world.