Seasonal heat content compared to the 1955-2006 average for the upper 700 meters of the ocean (light blue-green) and in the upper 2000 meters (dark blue-green). Heat content in the global ocean has been above-average since the mid-1990s. Graph by Climate.us, based on data from NOAA NCEI.
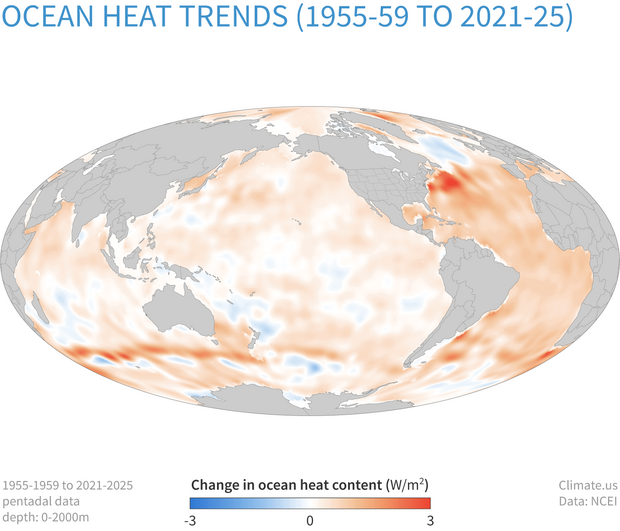
Change in heat content in the upper 2,000 meters (1.2 miles) of the ocean from 1955-1959 to 2021-2025. More places have gained heat (orange) than lost it (blue). NOAA NCEI data.