Climate change: ocean heat content
This article was last updated on Climate.gov on 6/25/2025. Climate.us revisions began in June 2026.
Overview
Carbon dioxide and other greenhouse gases that humans have added to the atmosphere are preventing heat energy radiated from Earth's surface and atmosphere from escaping into space as freely as it used to. The global ocean is storing 9/10 of that excess heat. From 1993 to 2025, every square meter of the ocean absorbed an average of about 1 Watt of excess heat per square meter.
A Watt may seem small, but added up across the entire ocean surface for 33 years, that’s around 376 zettajoules of heat energy. (Zetta is a billion times a billion times a thousand: a 1 followed by 21 zeros). That’s the same order of magnitude as the energy released by the asteroid impact that led to the extinction of the dinosaurs.
Some parts of the global ocean are accumulating heat much more quickly than others. A 2022 assessment of trends over the period 1958-2019 found that warming rates are highest in the Southern Ocean and the Atlantic Ocean. Together those basins hold about 70 percent of the total ocean heat gain over that period. The upper ocean is gaining heat the most quickly, but all layers of the ocean are now warming as currents mix heated surface water down into the depths.
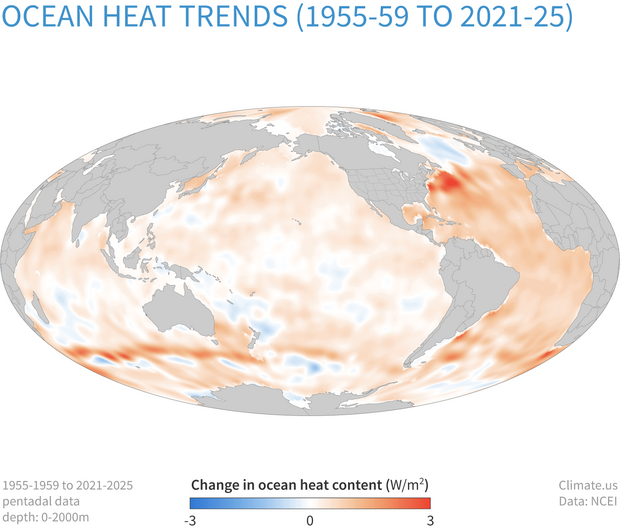
Change in stored heat content in the upper 2,000 meters (1.2 miles) of the ocean from 1955-1959 to 2021-2025 using 'pentadal' data where each yearly value is the average of a five-year window centered on that year. Darkest orange areas show where heat content increased by 3 or more watts per square meter. Some areas have lost heat (blue), but not enough to offset increases everywhere else. Climate.us image, based on NOAA Climate Data Record (CDR) data from NCEI.
Why ocean heating matters
By absorbing excess heat and shifting it away from the surface, the ocean has been preventing surface temperatures from rising as much as they otherwise could have given the amount of greenhouse gases humans have added to the atmosphere. But heat can’t disappear, so the ocean’s buffering of surface warming has serious and far-reaching consequences:
- Ocean warming has caused about half of the observed global sea level rise to date;
- Marine heat waves are becoming more frequent and intense, harming ocean life;
- Warming oceans melt sea ice and thin glaciers and ice sheets that reach into the ocean on Greenland and Antarctica;
- Faster warming near the surface creates a lighter layer of water that resists vertical mixing, stifling the vertical exchange of nutrients and oxygen that are vital to marine life;
- Rising sea surface temperatures are intensifying hurricanes and nor’easters;
- Increased evaporation from warmer oceans is increasing global humidity and intensifying extreme rainfall events.
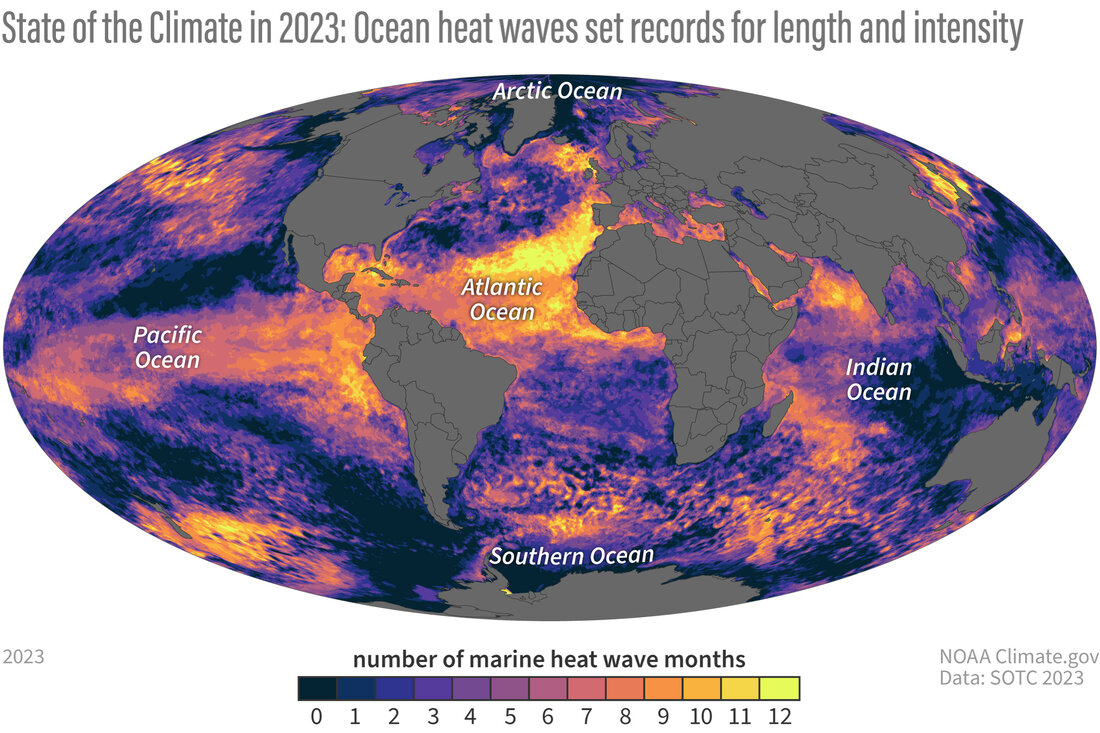
This map shows the number of months each part of the global ocean experienced heat wave conditions in 2023, meaning that for a given time of year, the monthly average temperatures were in the hottest 10 percent of all monthly temperatures from 1991-2020. Very few areas experienced less than one full month of heat wave conditions (darkest blue). Relatively large swaths of the eastern North Atlantic experienced heat wave conditions virtually all year (bright yellow). NOAA Climate.gov image, adapted from Figure SB3.1 in State of the Climate in 2023.
How the ocean gains heat
The main source of ocean heat is sunlight. But clouds, water vapor, and greenhouse gases also emit heat that they have absorbed, and some of that heat energy enters the ocean. Waves, tides, and currents constantly mix the ocean, moving heat from warmer to cooler latitudes and from the surface to greater depths. The ocean surface also radiates heat (thermal infrared radiation), and it loses heat when water evaporates (latent heat). If the ocean absorbs more heat than it releases over a given time span, its total heat content increases.
The rate of ocean heating varies from place to place, year to year, and decade to decade. These variations are due to natural climate variability, especially the El Niño-Southern Oscillation, in the tropical Pacific Ocean. Other ocean basins have their own patterns of variability. But since the mid-20th century, the ocean’s heat content has been steadily rising due to the heating influence of greenhouse gases humans have added to the atmosphere.
Measuring ocean heat
Historically, taking the ocean’s temperature required ships to dangle sensors or sample collectors into the water. This time-consuming method could only provide temperatures for a small part of the planet’s vast ocean. To get global coverage, scientists turned to satellites that measure the height of the ocean’s surface. As water warms, it expands, so estimates for ocean temperature can be deduced from sea surface heights.

Instruments for taking ocean temperatures include Conductivity-Temperature-Depth instruments (known as CTDs), Expendable Bathythermographs (known as XBTs), and Argo floats. Seals have even been fitted with instruments to obtain temperatures in areas that are difficult to reach. (Photos courtesy of NOAA, Kara Lavender, and M. Weise, California Sea Grant.)
To get a more complete picture of ocean heat content at different depths, scientists and engineers also use a range of in situ temperature-sensing instruments. Among these are a fleet of more than 3,000 robotic “floats” that measure ocean temperature around the world. Known as Argo floats, the sensors drift through the ocean at different depths. Every 10 days or so, according to their programmed instructions, they rise through the water, recording temperature (and salinity) as they ascend. When a float reaches the surface, it sends its location and other information to scientists via satellite and then descends again.
Scientists constantly compare data from satellites, floats, and other instruments to verify that the values they produce make sense. They process the range of measurements to calculate an estimate for global average ocean heat content every three months. Converting the temperatures to joules (a standard unit of energy) allows them to compare heat in the ocean to heat in other parts of Earth’s climate system.
All depths of the ocean are warming
Human-produced greenhouse gases trapped an estimated 435 zettajoules of excess heat energy in Earth’s climate system in the 48 years from 1971-2018. Of that total, the ocean has absorbed 91 percent, or 394 zettajoules. Just over 60 percent of that is in the upper 700 meters (0.4 miles) of the ocean. The intermediate ocean, between 700 and 2,000 meters (0.4-1.2 miles), is holding on to about 24 percent of the total ocean heat. Waters below 2,000 meters (1.2 miles) are storing the remaining 14 percent.
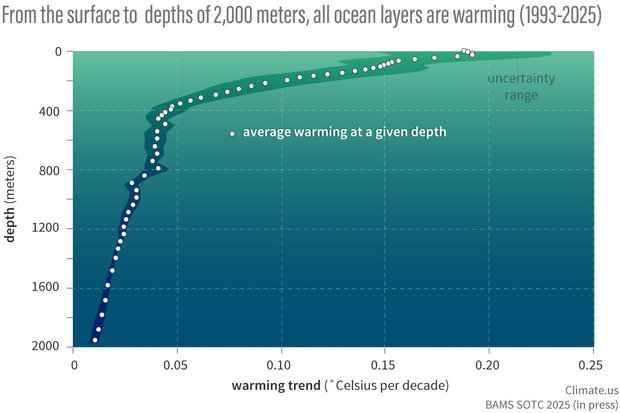
Warming of the global ocean from the surface to depths of 2,000 meters from 1993-2025. Each dot shows the average warming in degrees Celsius per decade at a given depth. Rates range from close to 0.2 degrees C (0.45 degrees Fahrenheit) of warming per decade at the surface to a hundredth of a degree per decade near 2,000 meters depth. Climate.us image, adapted from Figure 3.6 in State of the Climate in 2025, in press.
Like the global average temperature trend, the rate of ocean heating has accelerated in recent decades. In the past 33 years (1993-2025), the upper 700 meters of the ocean absorbed in the range of 207-255 Zettajoules of heat energy. An additional 94-113 Zettajoules of heat accumulated at depths between 700–2,000 meters. Below 2,000 meters, the estimated increase was 32 Zettajoules from February 1988 to June 2015. Altogether, that’s in the range of 333-400 Zettajoules. That means the ocean absorbed nearly as much heat in the past 33 years as it did in the 48 years between 1971-2018.
Some oceans are warming faster than others
The rate of ocean heat uptake doesn’t just vary at different depths; it varies from place to place due to tides, currents, and evaporation and rainfall that constantly move and mix the upper ocean. From year to year, differences can emerge due to natural climate variations like the El Niño-Southern Oscillation. On longer time scales (many decades to centuries), regional differences also reflect the work of the global meridional overturning circulation—an escalator that moves water from the surface to the deep ocean and back over centuries.
The main sinking branches of the escalator are found in the northern North Atlantic and the ocean around Antarctica, and this fact is likely to be part of the reason that those regions have stored the lion’s share of the excess heat the global ocean has absorbed since the middle of the 20th century.
By one research team’s estimate, the Atlantic is storing around 33% of the excess heat energy absorbed by the global ocean from 1958-2019. That’s 13% more than the Pacific Ocean, the planet’s largest, which is twice the Atlantic’s size. The Southern Ocean is an even stronger heat sink: the planet’s second-smallest ocean is storing an estimated 36% of the global ocean heat uptake over that same period. The remaining excess heat is split between the Indian Ocean (9%) and the Arctic Ocean (2.5%).
Putting ocean heat in perspective
Adding up the rates of ocean heating across all oceans and all layers from 1993-2025, the average full-depth, global ocean heat gain rate ranges from 0.92–1.05 Watts per square meter. (That’s 0.65–0.74 Watts per square meter averaged across Earth’s entire surface.)
One Watt per square meter may not sound like a lot, but a Watt is 1 Joule of energy every second. Multiplied over every square meter of ocean for 33 years, that comes to 376 zettajoules of heat energy. A zetta of something is one sextillion, a billion times a billion times a thousand: a 1 followed by 21 zeros.
A heat gain of 376 Zettajoules is the equivalent to the energy released by 100,000 volcanic eruptions as big as the Hunga-Tonga event in January 2022. It's as much energy as geologists estimate was released by the asteroid impact that drove the dinosaurs extinct. You could supply the whole world with power for more than 500 years at 2025 consumption rates. You could bring Lake Erie to a boil.
But perhaps the best way to put ocean heat gains in perspective is to consider how much that energy would warm the atmosphere. If the heat the ocean has absorbed since 1971 (~474 zettajoules) could be immediately transferred to the atmosphere, it would raise global average surface temperature by 92 degrees Celsius, or 166 degrees Fahrenheit.
References
Boyer, T.P., J. I. Antonov , O. K. Baranova, H. E. Garcia, D. R. Johnson, R. A. Locarnini, A. V. Mishonov, T. D. O’Brien, D. Seidov, I. V. Smolyar, M. M. Zweng, 2009. World Ocean Database 2009. S. Levitus, Ed., NOAA Atlas NESDIS 66, U.S. Gov. Printing Office, Wash., D.C., 216 pp., DVDs.
Cheng, L., von Schuckmann, K., Abraham, J. P., Trenberth, K. E., Mann, M. E., Zanna, L., England, M. H., Zika, J. D., Fasullo, J. T., Yu, Y., Pan, Y., Zhu, J., Newsom, E. R., Bronselaer, B., & Lin, X. (2022). Past and future ocean warming. Nature Reviews Earth & Environment, 3(11), 776–794. https://doi.org/10.1038/s43017-022-00345-1
Cheng, L., Li, G., Long, S.-M., Li, Y., Von Schuckmann, K., Trenberth, K. E., Mann, M. E., Abraham, J., Du, Y., Cheng, X., Liu, H., Xu, Z., Liu, M., Peng, Q., Gong, X., Ma, Z., & Yuan, H. (2025). Ocean stratification in a warming climate. Nature Reviews Earth & Environment, 6(10), 637–655. https://doi.org/10.1038/s43017-025-00715-5
End of the Cretaceous. (1998, January 1). Geological Society, London, Special Publications. https://www.lyellcollection.org/doi/10.1144/SP544-2023-176
Johnson, G. C., J. M. Lyman, L. Cheng, D. Giglio, R. E. Killick, M. Kuusela, R. Locarnini, A. Mishonov, M. Oe, J. Reagan, and T. Sukianto. (2025). Ocean temperature and heat content anomalies [in “State of the Climate in 2024”]. Bull. Amer. Meteor. Soc., 106 (8), S186–S189.
Levitus, S., J. I. Antonov, T. P. Boyer, R. A. Locarnini, H. E. Garcia, and A. V. Mishonov. 2009. “Global ocean heat content 1955–2008 in light of recently revealed instrumentation problems” Geophysical Research Letters, 36, L07608, doi:10.1029/2008GL037155.
Marshall, J., & Speer, K. (2012). Closure of the meridional overturning circulation through Southern Ocean upwelling. Nature Geoscience, 5(3), 171–180. https://doi.org/10.1038/ngeo1391
Rhein, M., S. R. Rintoul, S. Aoki, E. Campos, D. Chambers, R. A. Feely, S. Gulev, G. C. Johnson, S. A. Josey, A. Kostianoy, C. Mauritzen, D. Roemmich, L. D. Talley, and F. Wang,2013: Observations: Ocean. In: Climate Change 2013: The Physical Science Basis. Contribution of Working Group I to the Fifth Assessment Report of the Intergovernmental Panel on Climate Change [Stocker, T. F., D. Qin, G.-K. Plattner, M. Tignor, S. K. Allen, J. Boschung, A. Nauels, Y. Xia, V. Bex and P. M. Midgley (eds.)]. Cambridge University Press, Cambridge, United Kingdom and New York, NY, USA, doi:10.1017/CBO9781107415324.010.
Smith, K. E., Burrows, M. T., Hobday, A. J., King, N. G., Moore, P. J., Gupta, A. S., Thomsen, M. S., Wernberg, T., & Smale, D. A. (2023). Biological Impacts of Marine Heatwaves. Annual Review of Marine Science, 15(Volume 15, 2023), 119–145. https://doi.org/10.1146/annurev-marine-032122-121437