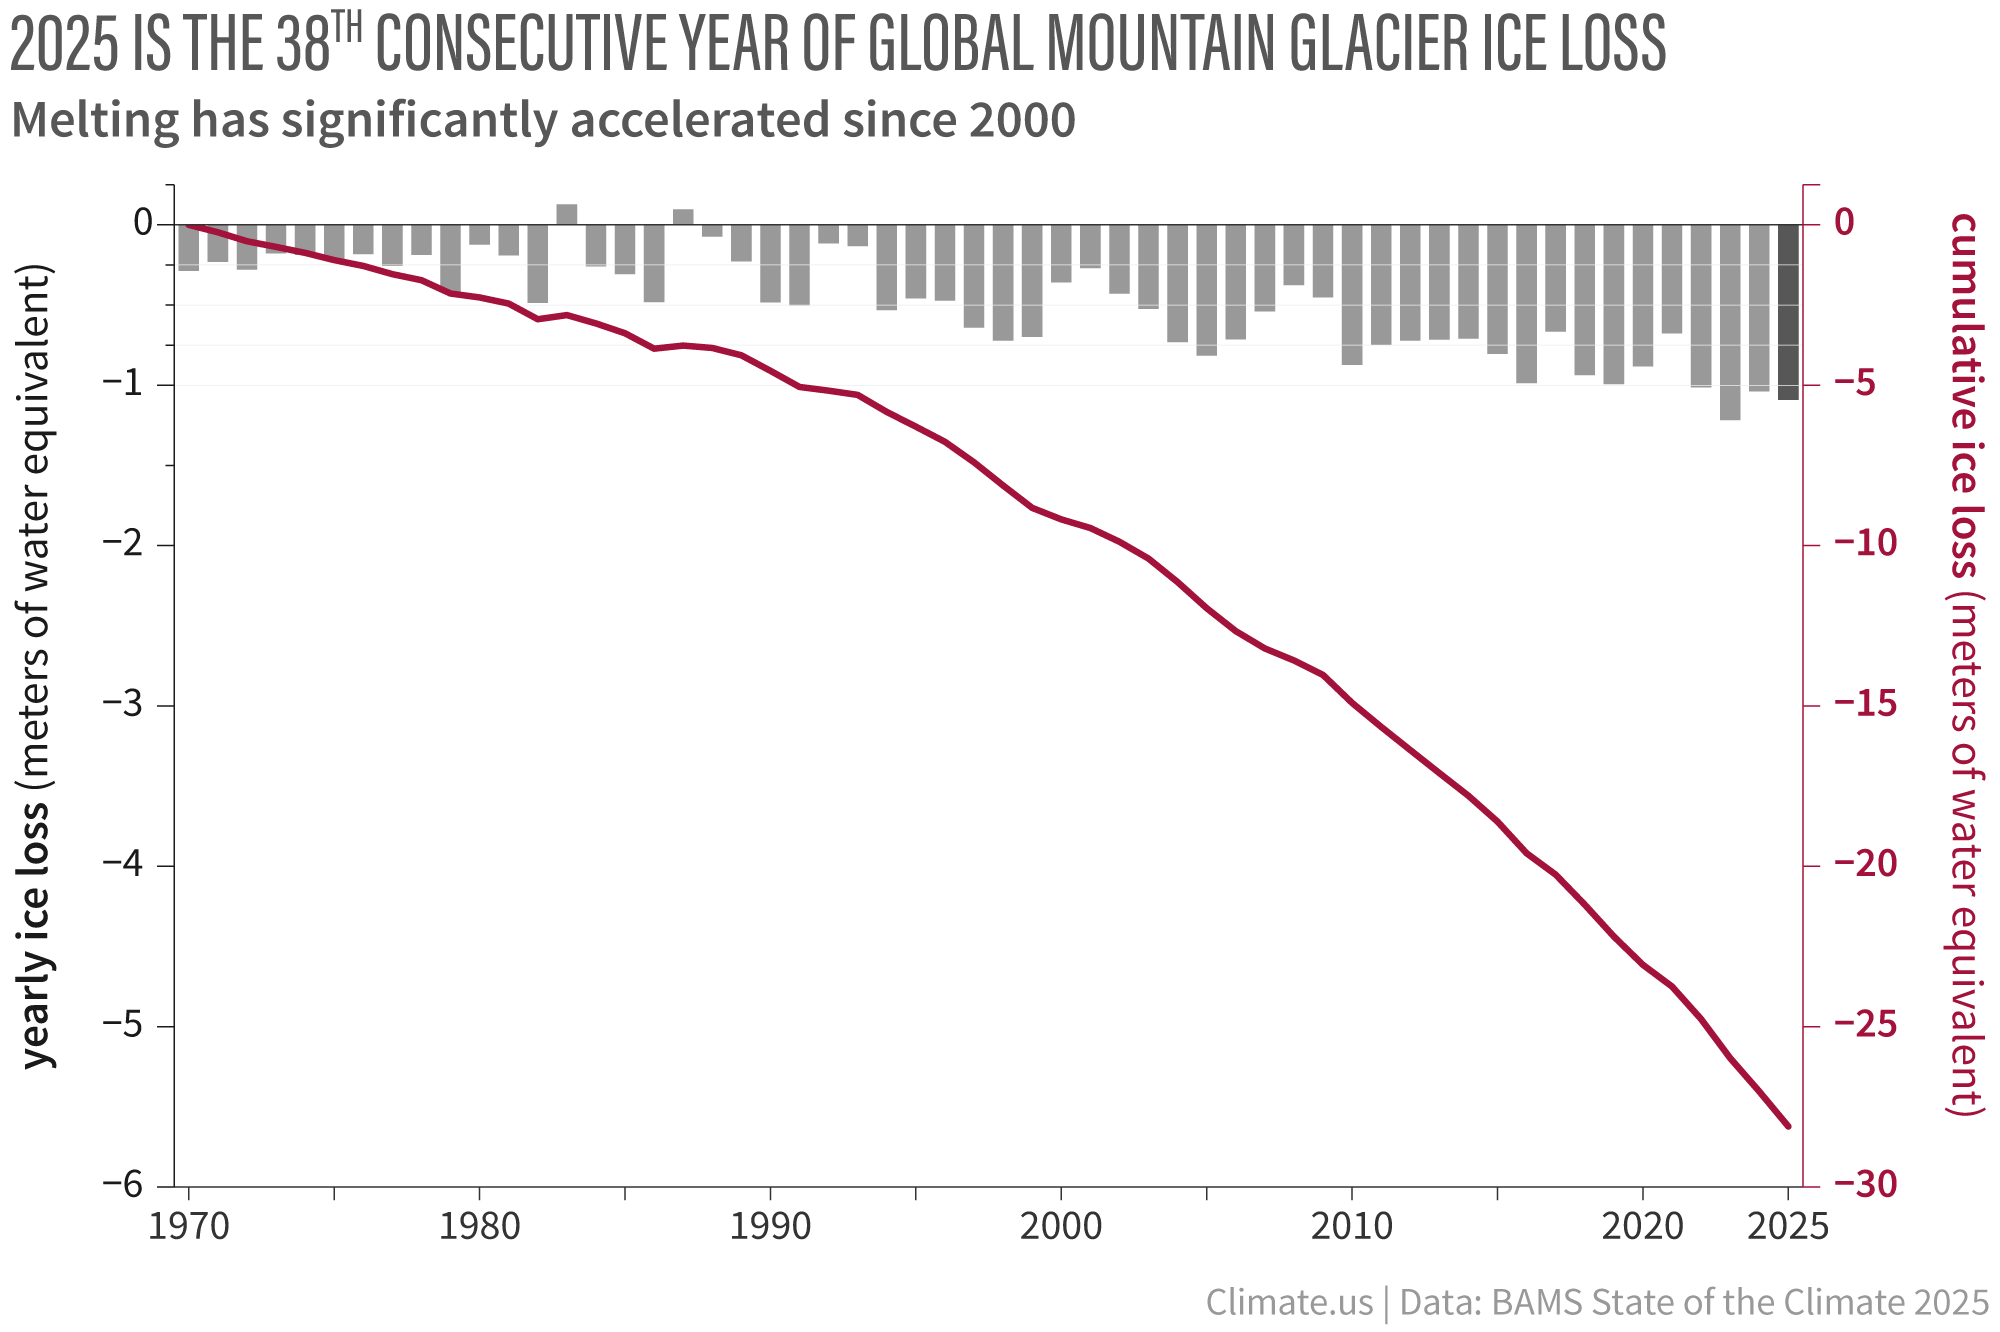
Yearly net gain or loss of ice mass in the World Glacier Monitoring Service "reference glacier" network since 1970 (gray bars, amount on left-hand vertical axis) combined with the running total ice loss through 2025 (red line, values on right-hand vertical axis.) Climate.us graph adapted from Figure 2.18 in State of the Climate in 2025.