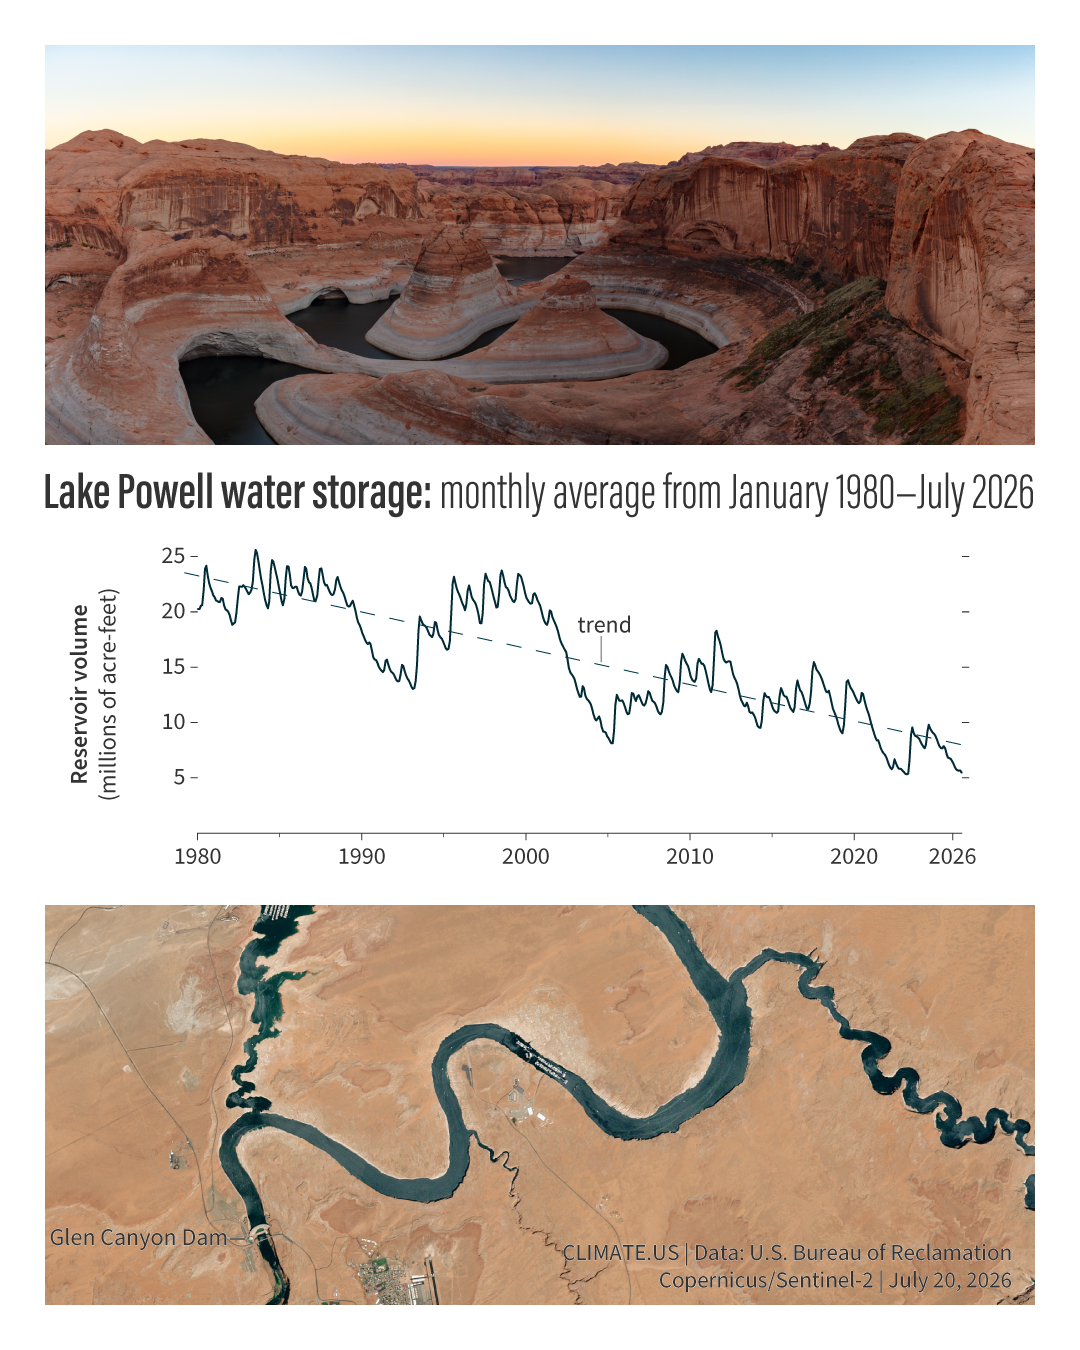
Graph of Lake Powell water levels that show while there is a natural peak most summers followed by a low in the spring, there has been an overall downward trend since around 2000. Data from the U.S. Bureau of Reclamation. Satellite image from July 20, 2026 from Copernicus/Sentinel. Photo from Adobe Stock.