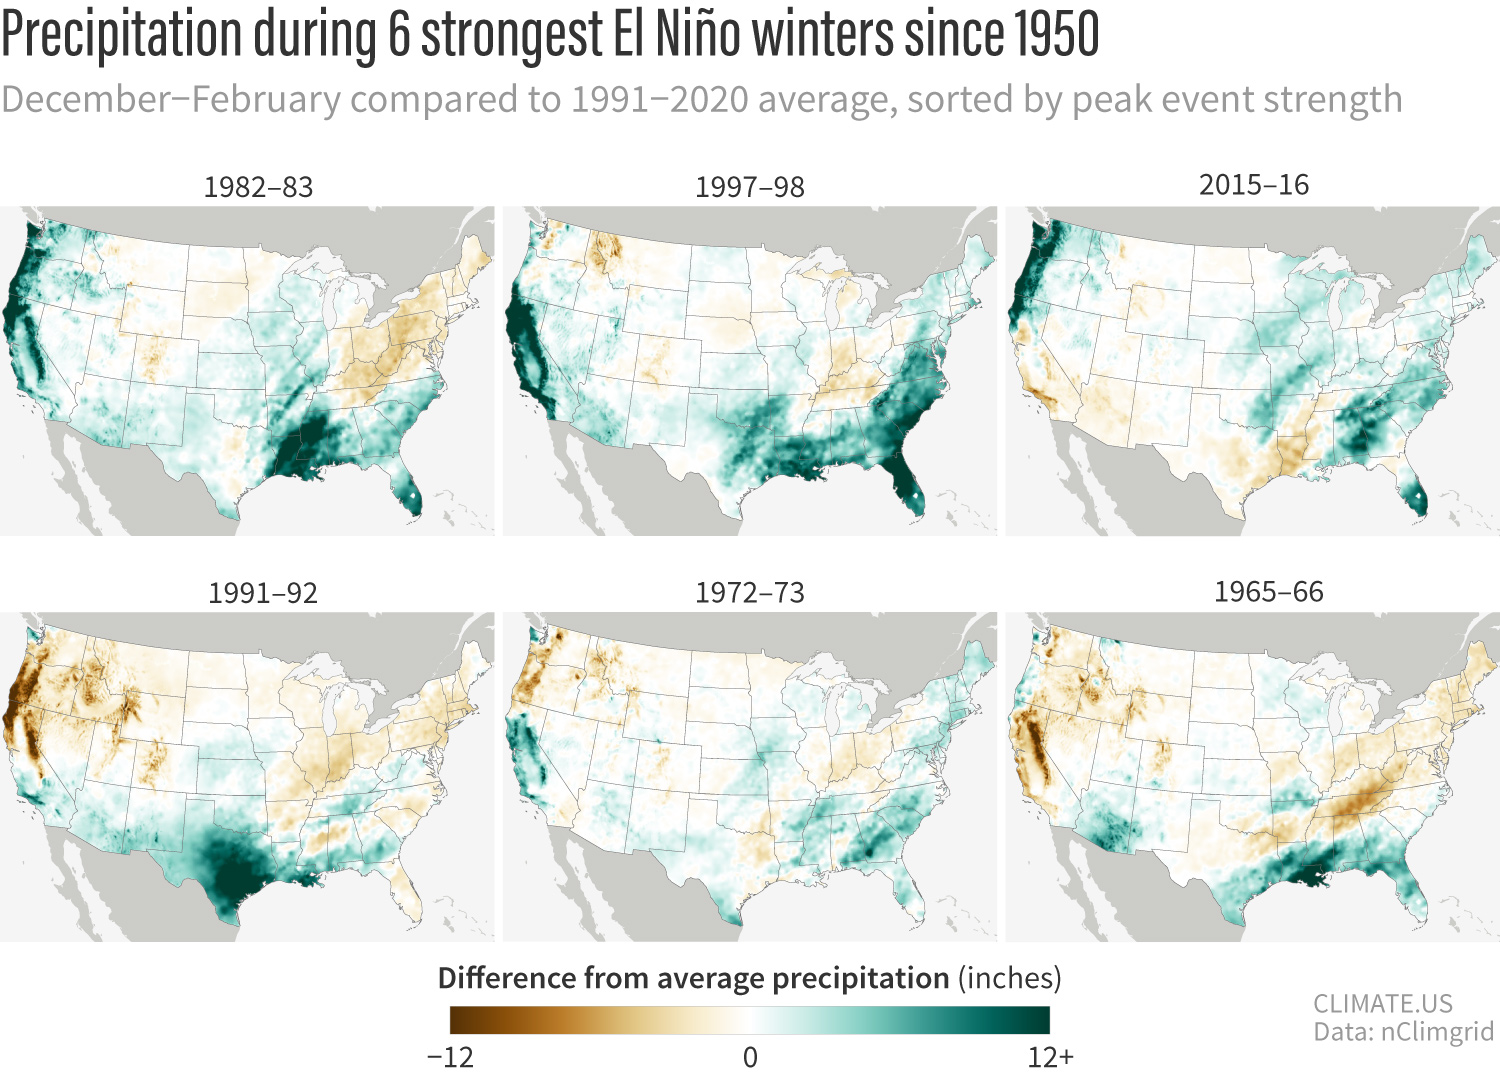
Winter (December–February) precipitation in the contiguous United States compared to the 1991-2020 average for the six strongest El Niño events on record. Green means wetter than average; brown means drier than average. Years are sorted upper left to lower right by peak event strength in any season (not necessarily December–February strength) based on Relative Oceanic Niño Index values.