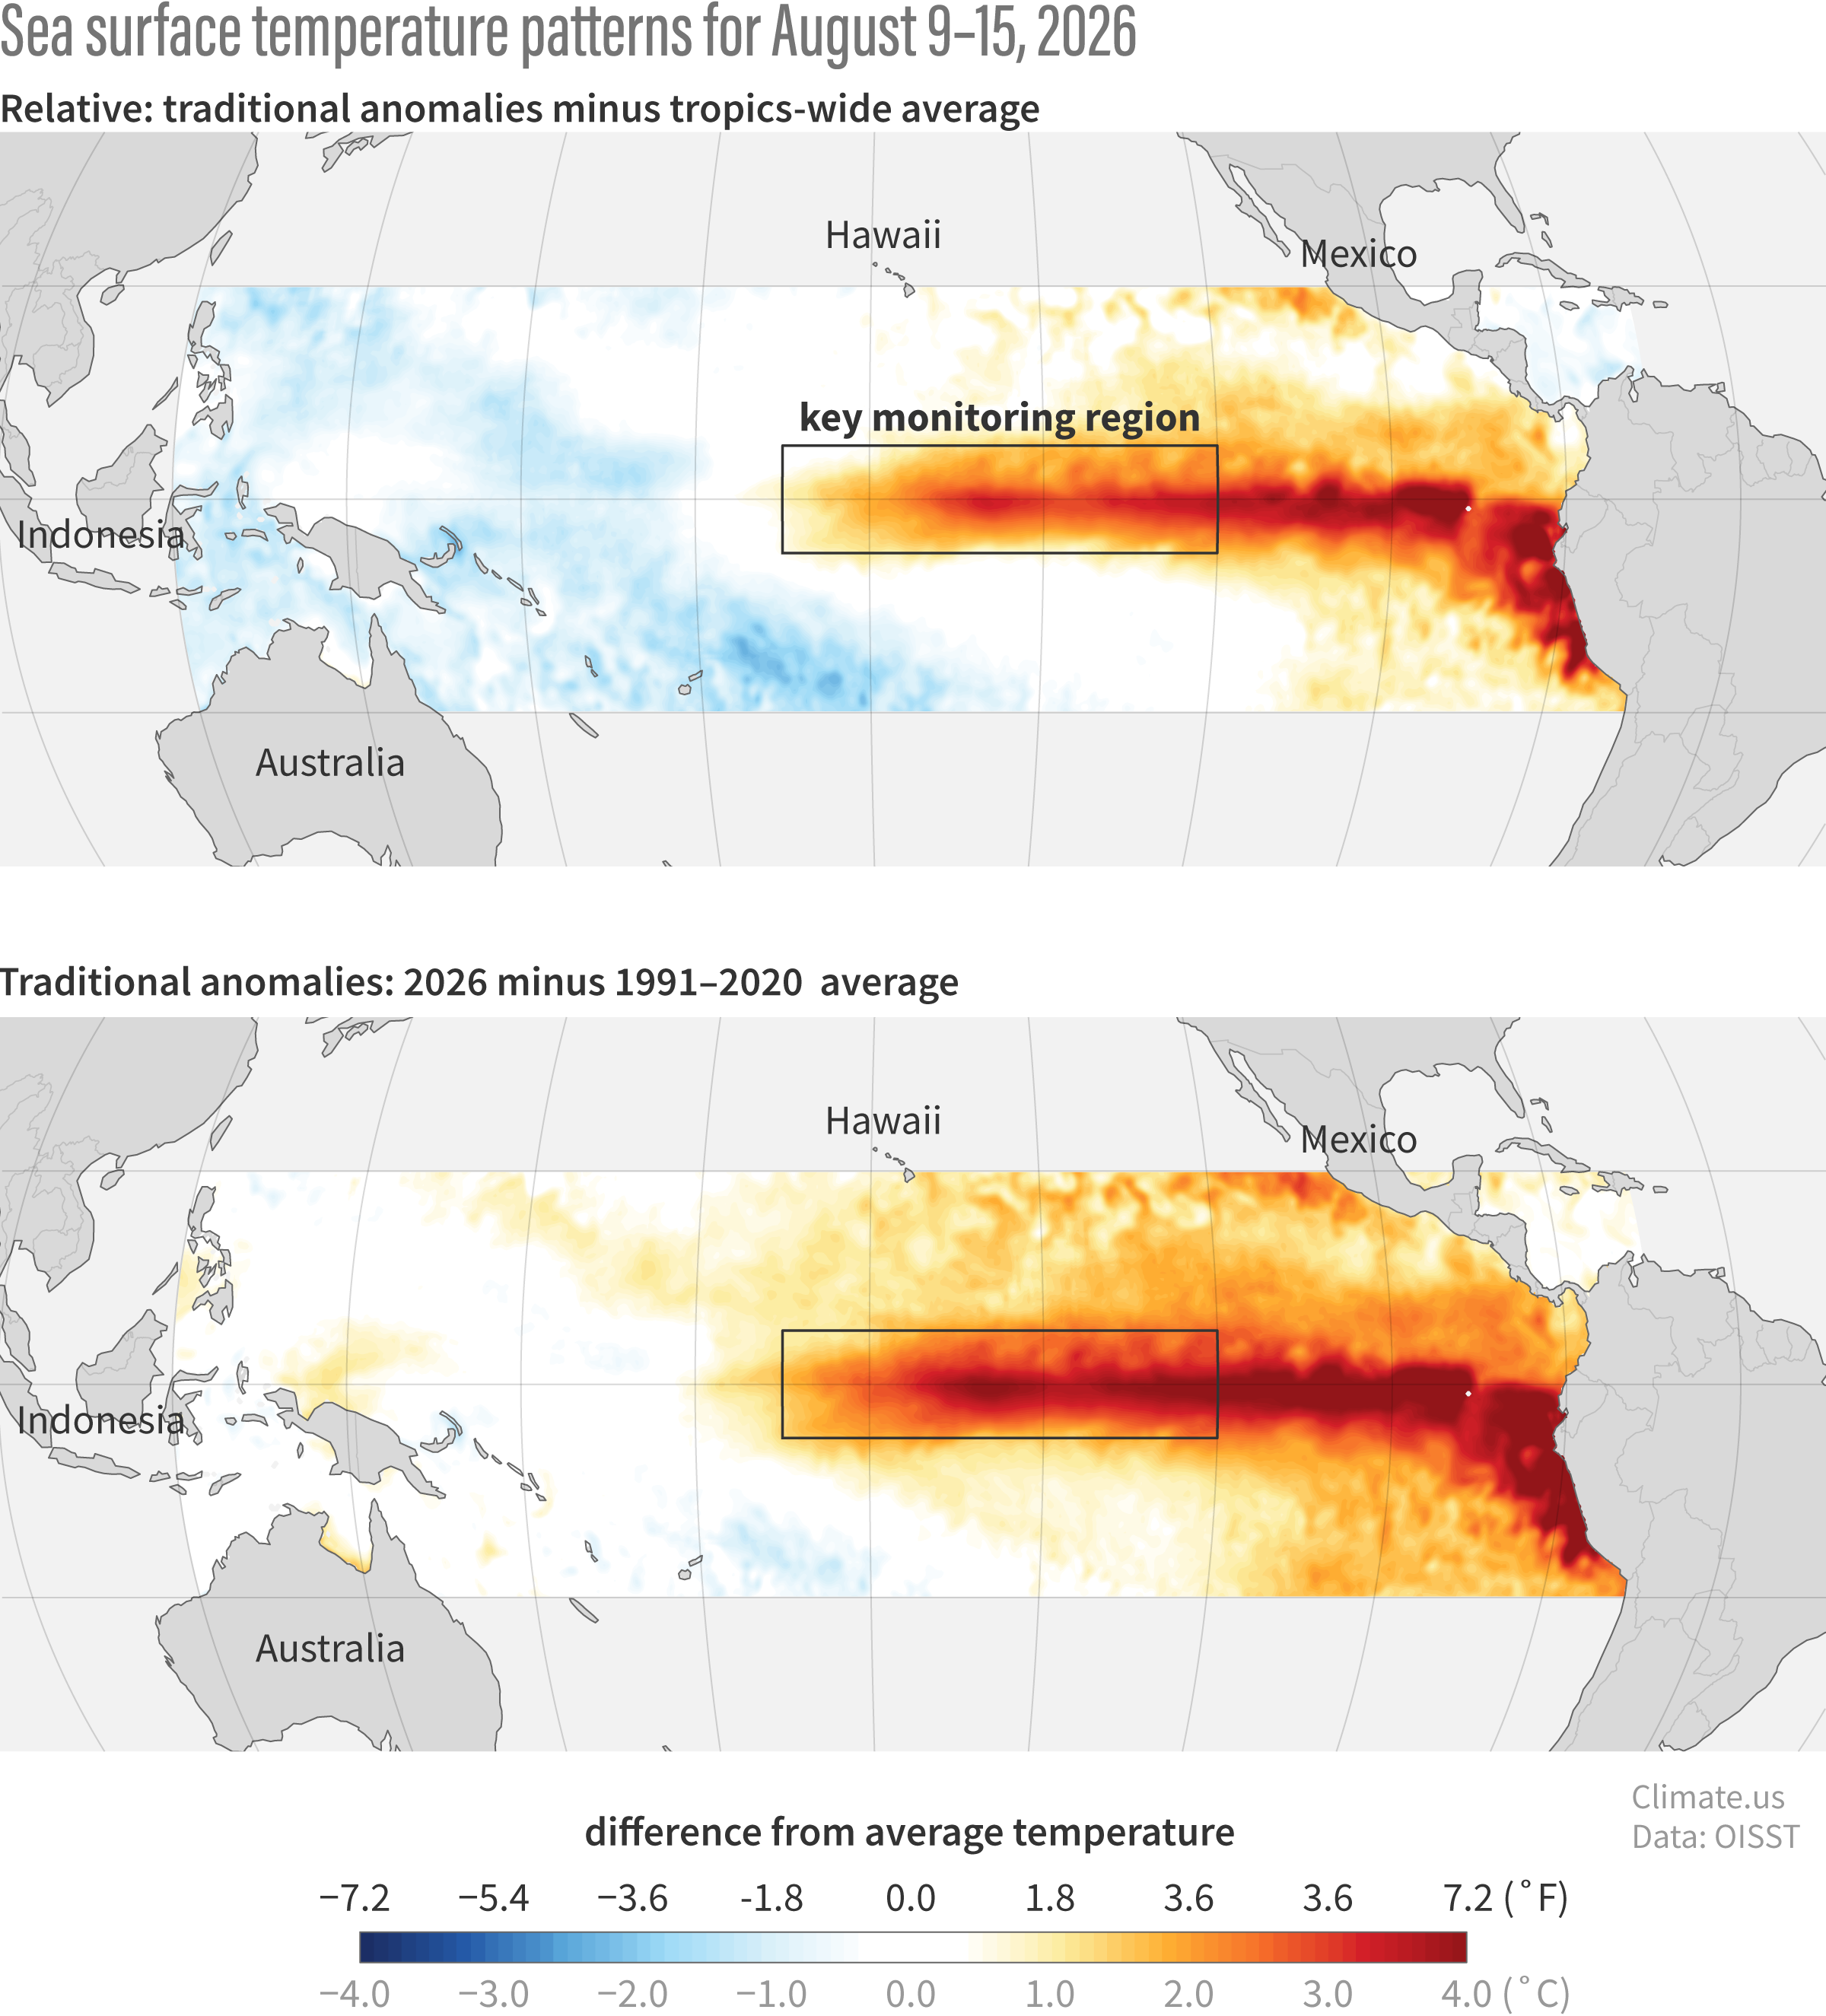
(top) NOAA's new yardstick for measuring the strength of El Niño and La Niña compares sea surface temperatures in the tropical Pacific first to the long-term average (1991-2020) and then to the average anomaly across the whole tropics. (bottom) The original yardstick only compared current temperatures to the long-term average. See the difference? The warm anomaly (red, oranges) in the central/eastern Pacific gets a little weaker—we've removed some of the influence of long-term global warming—but it's more obvious that the area is significantly warmer than the western part of the basin (blue). Climate.us image, based on NOAA OISST data.