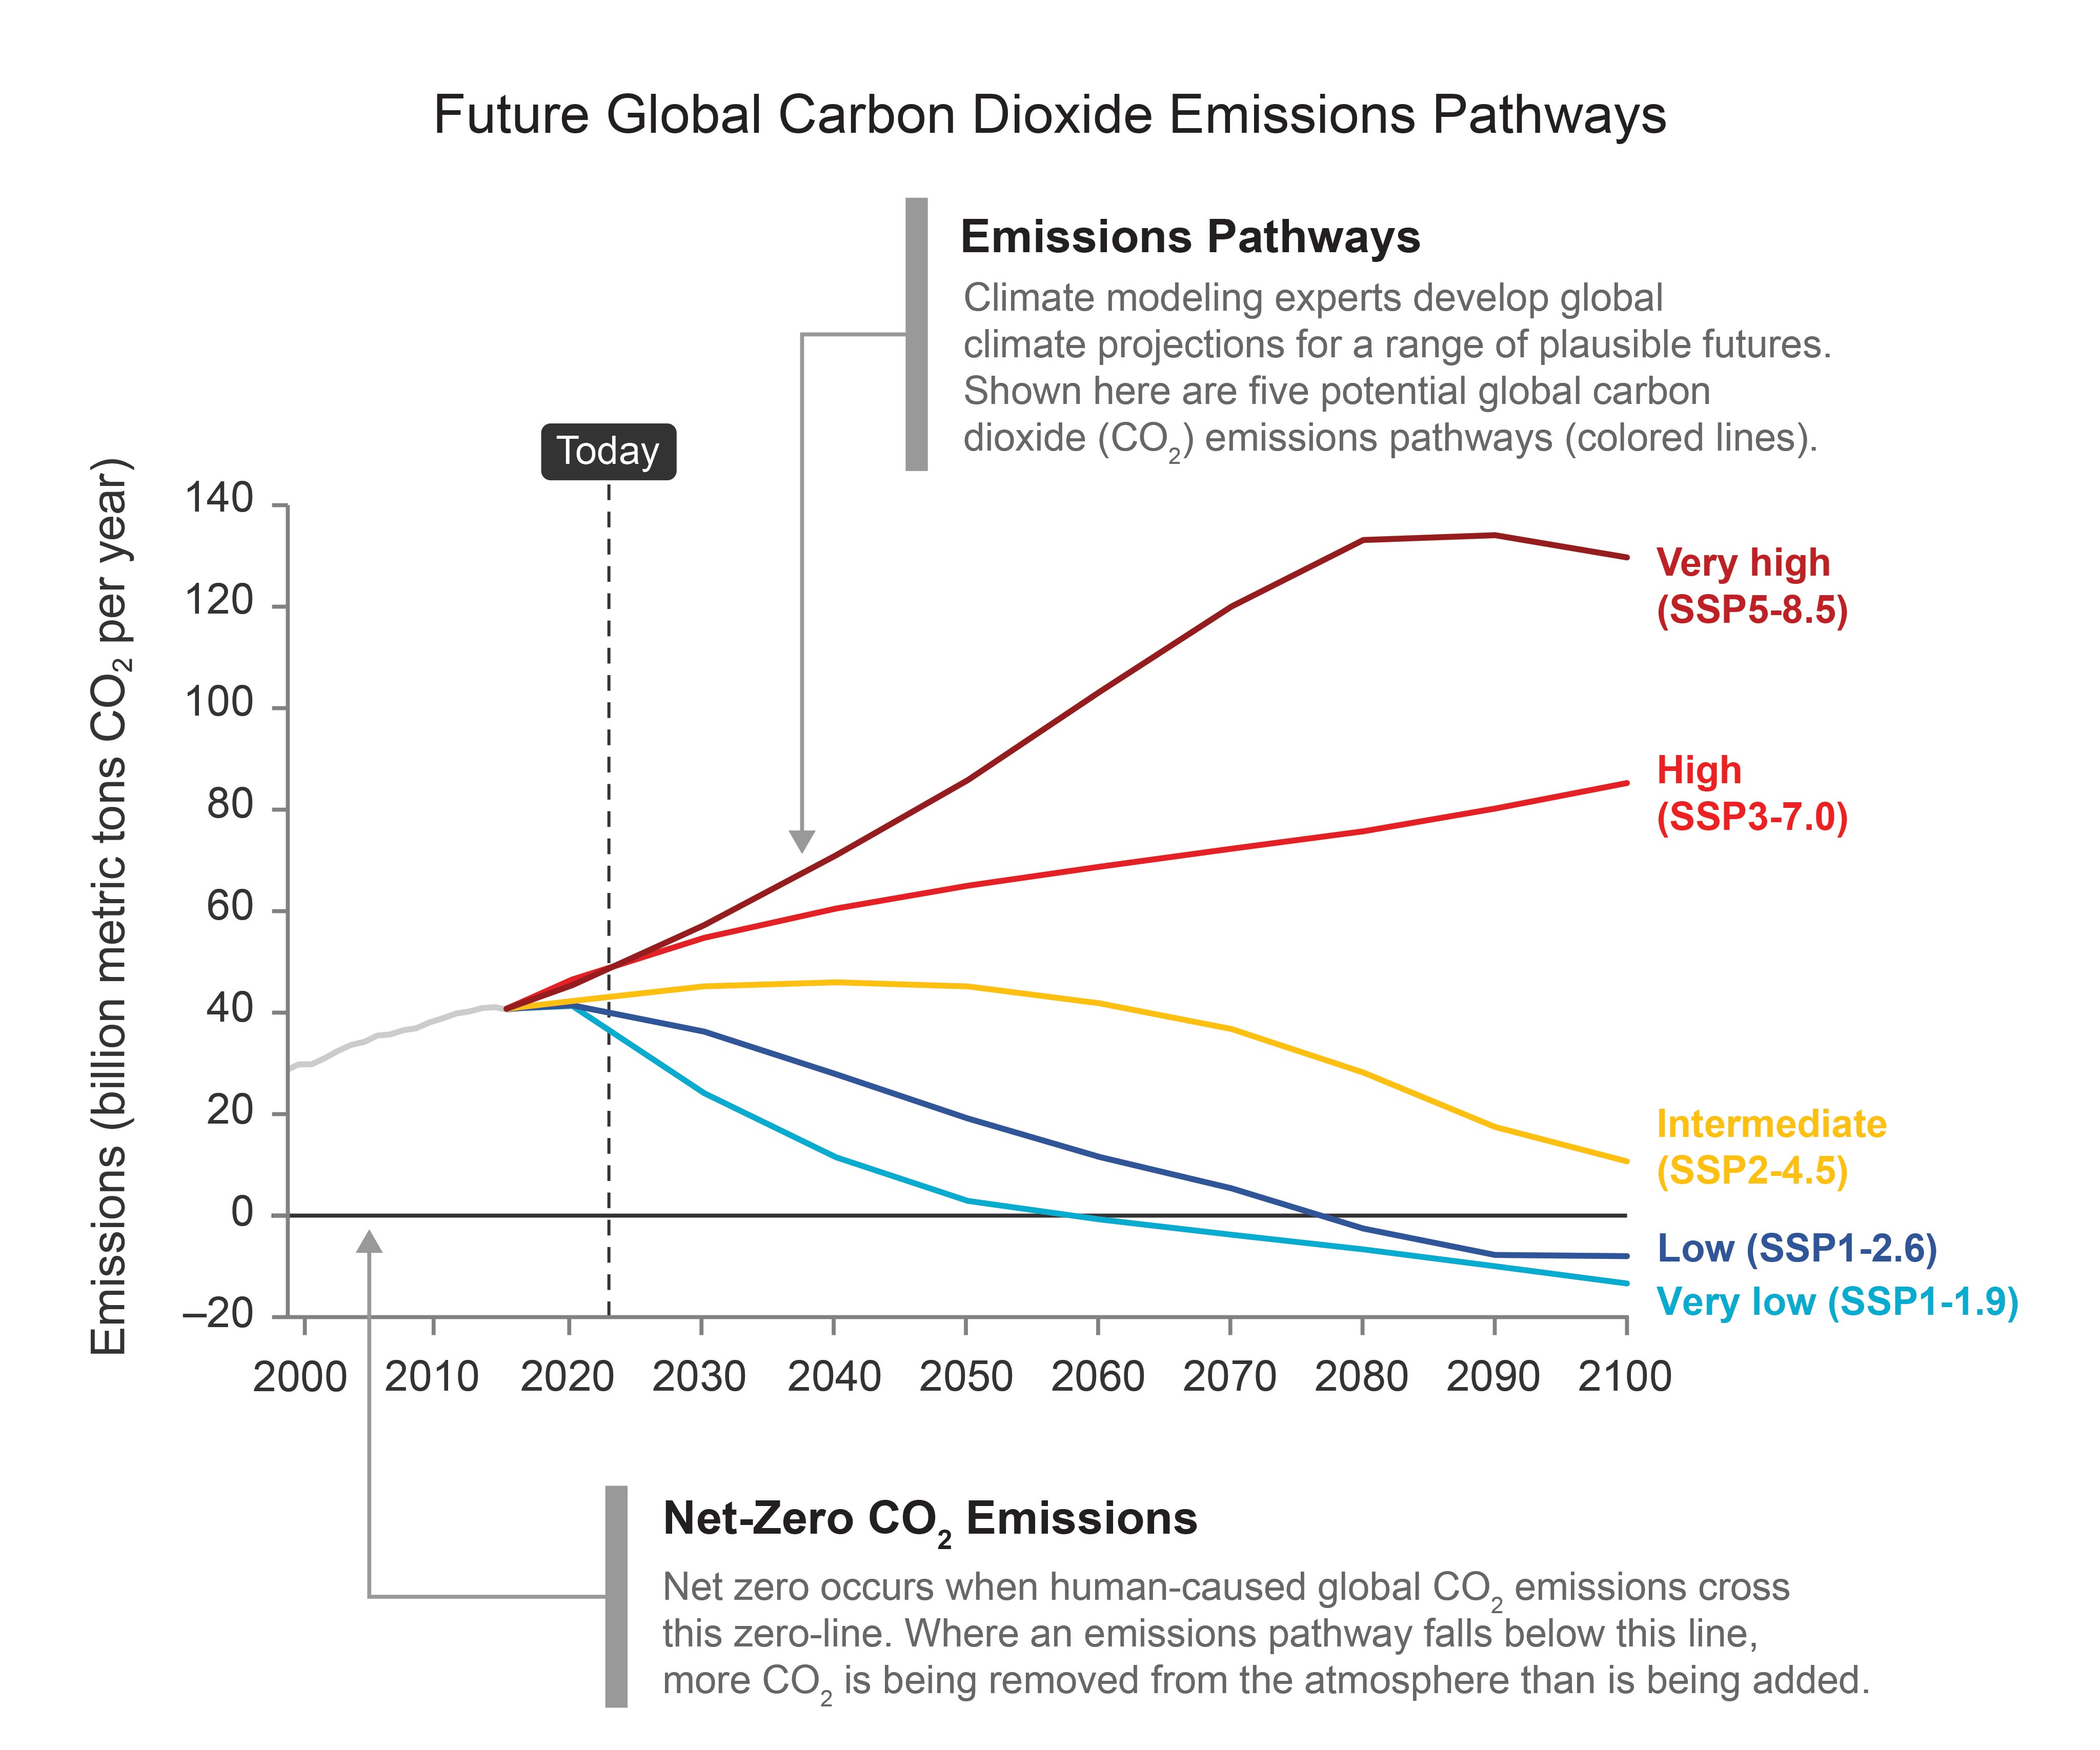
(As captioned in NCA5.) Different scenarios of future carbon dioxide emissions are used to explore the range of possible climate futures.
FIGURE 1.4. The five scenarios shown (colored lines) demonstrate potential global carbon dioxide (CO2) emissions pathways modeled from 2015 through 2100, with the solid light gray line showing observed global CO2 emissions from 2000 to 2015. See Table 3 in the Guide to the Report for scenario definitions. Many projected impacts described in this report are based on a potential climate future defined by one or more of these scenarios for future CO2 emissions from human activities, the largest long-term driver of climate change. The vertical dashed line, labeled “Today,” marks the year 2023; the solid horizontal black line marks net-zero CO2 emissions. Adapted with permission from Figure TS.4 in Arias et al. 2021.