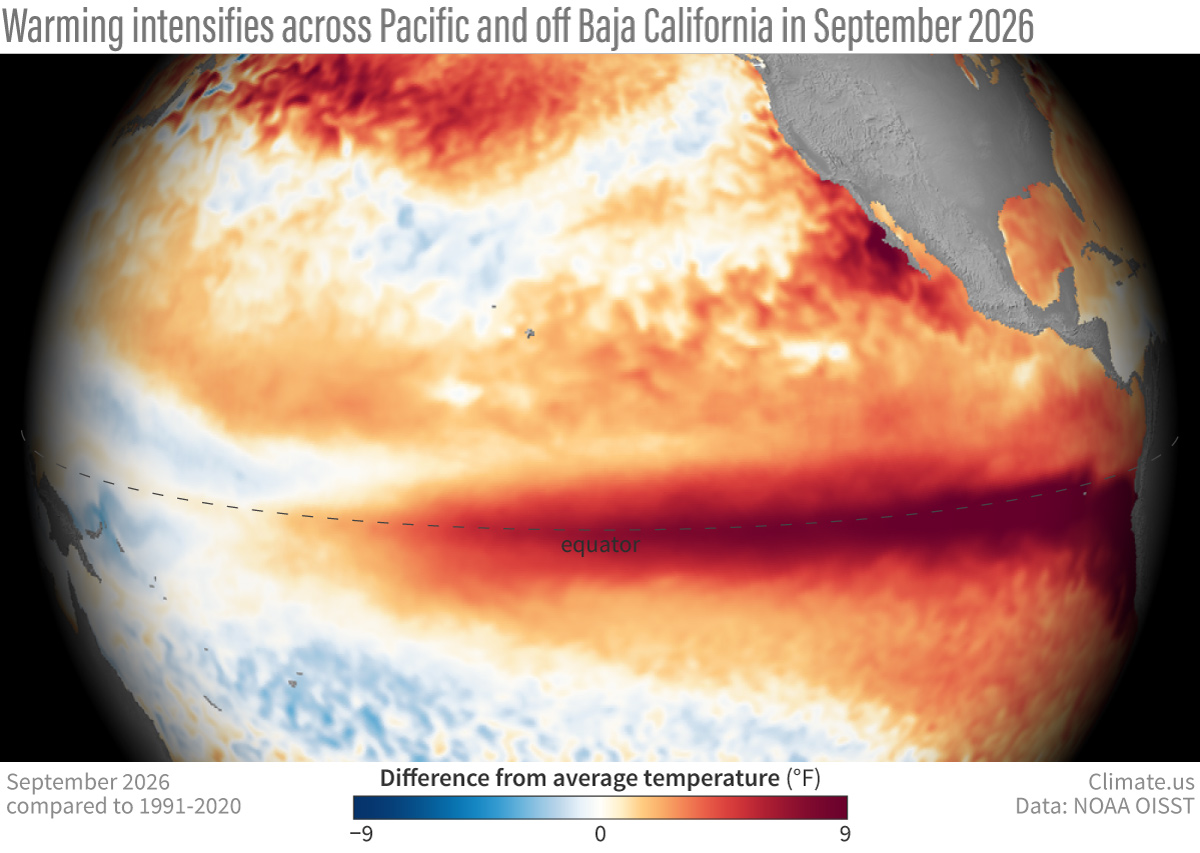
Pacific Ocean surface temperatures in September 2026 compared to the 1991-2020 average. The extremely warm waters across the equator (dark red) are one indicator of a strengthening El Niño event. Climate.us image, based on NOAA OISST data.
Pacific Ocean surface temperatures in September 2026 compared to the 1991-2020 average. The extremely warm waters across the equator (dark red) are one indicator of a strengthening El Niño event. Climate.us image, based on NOAA OISST data.