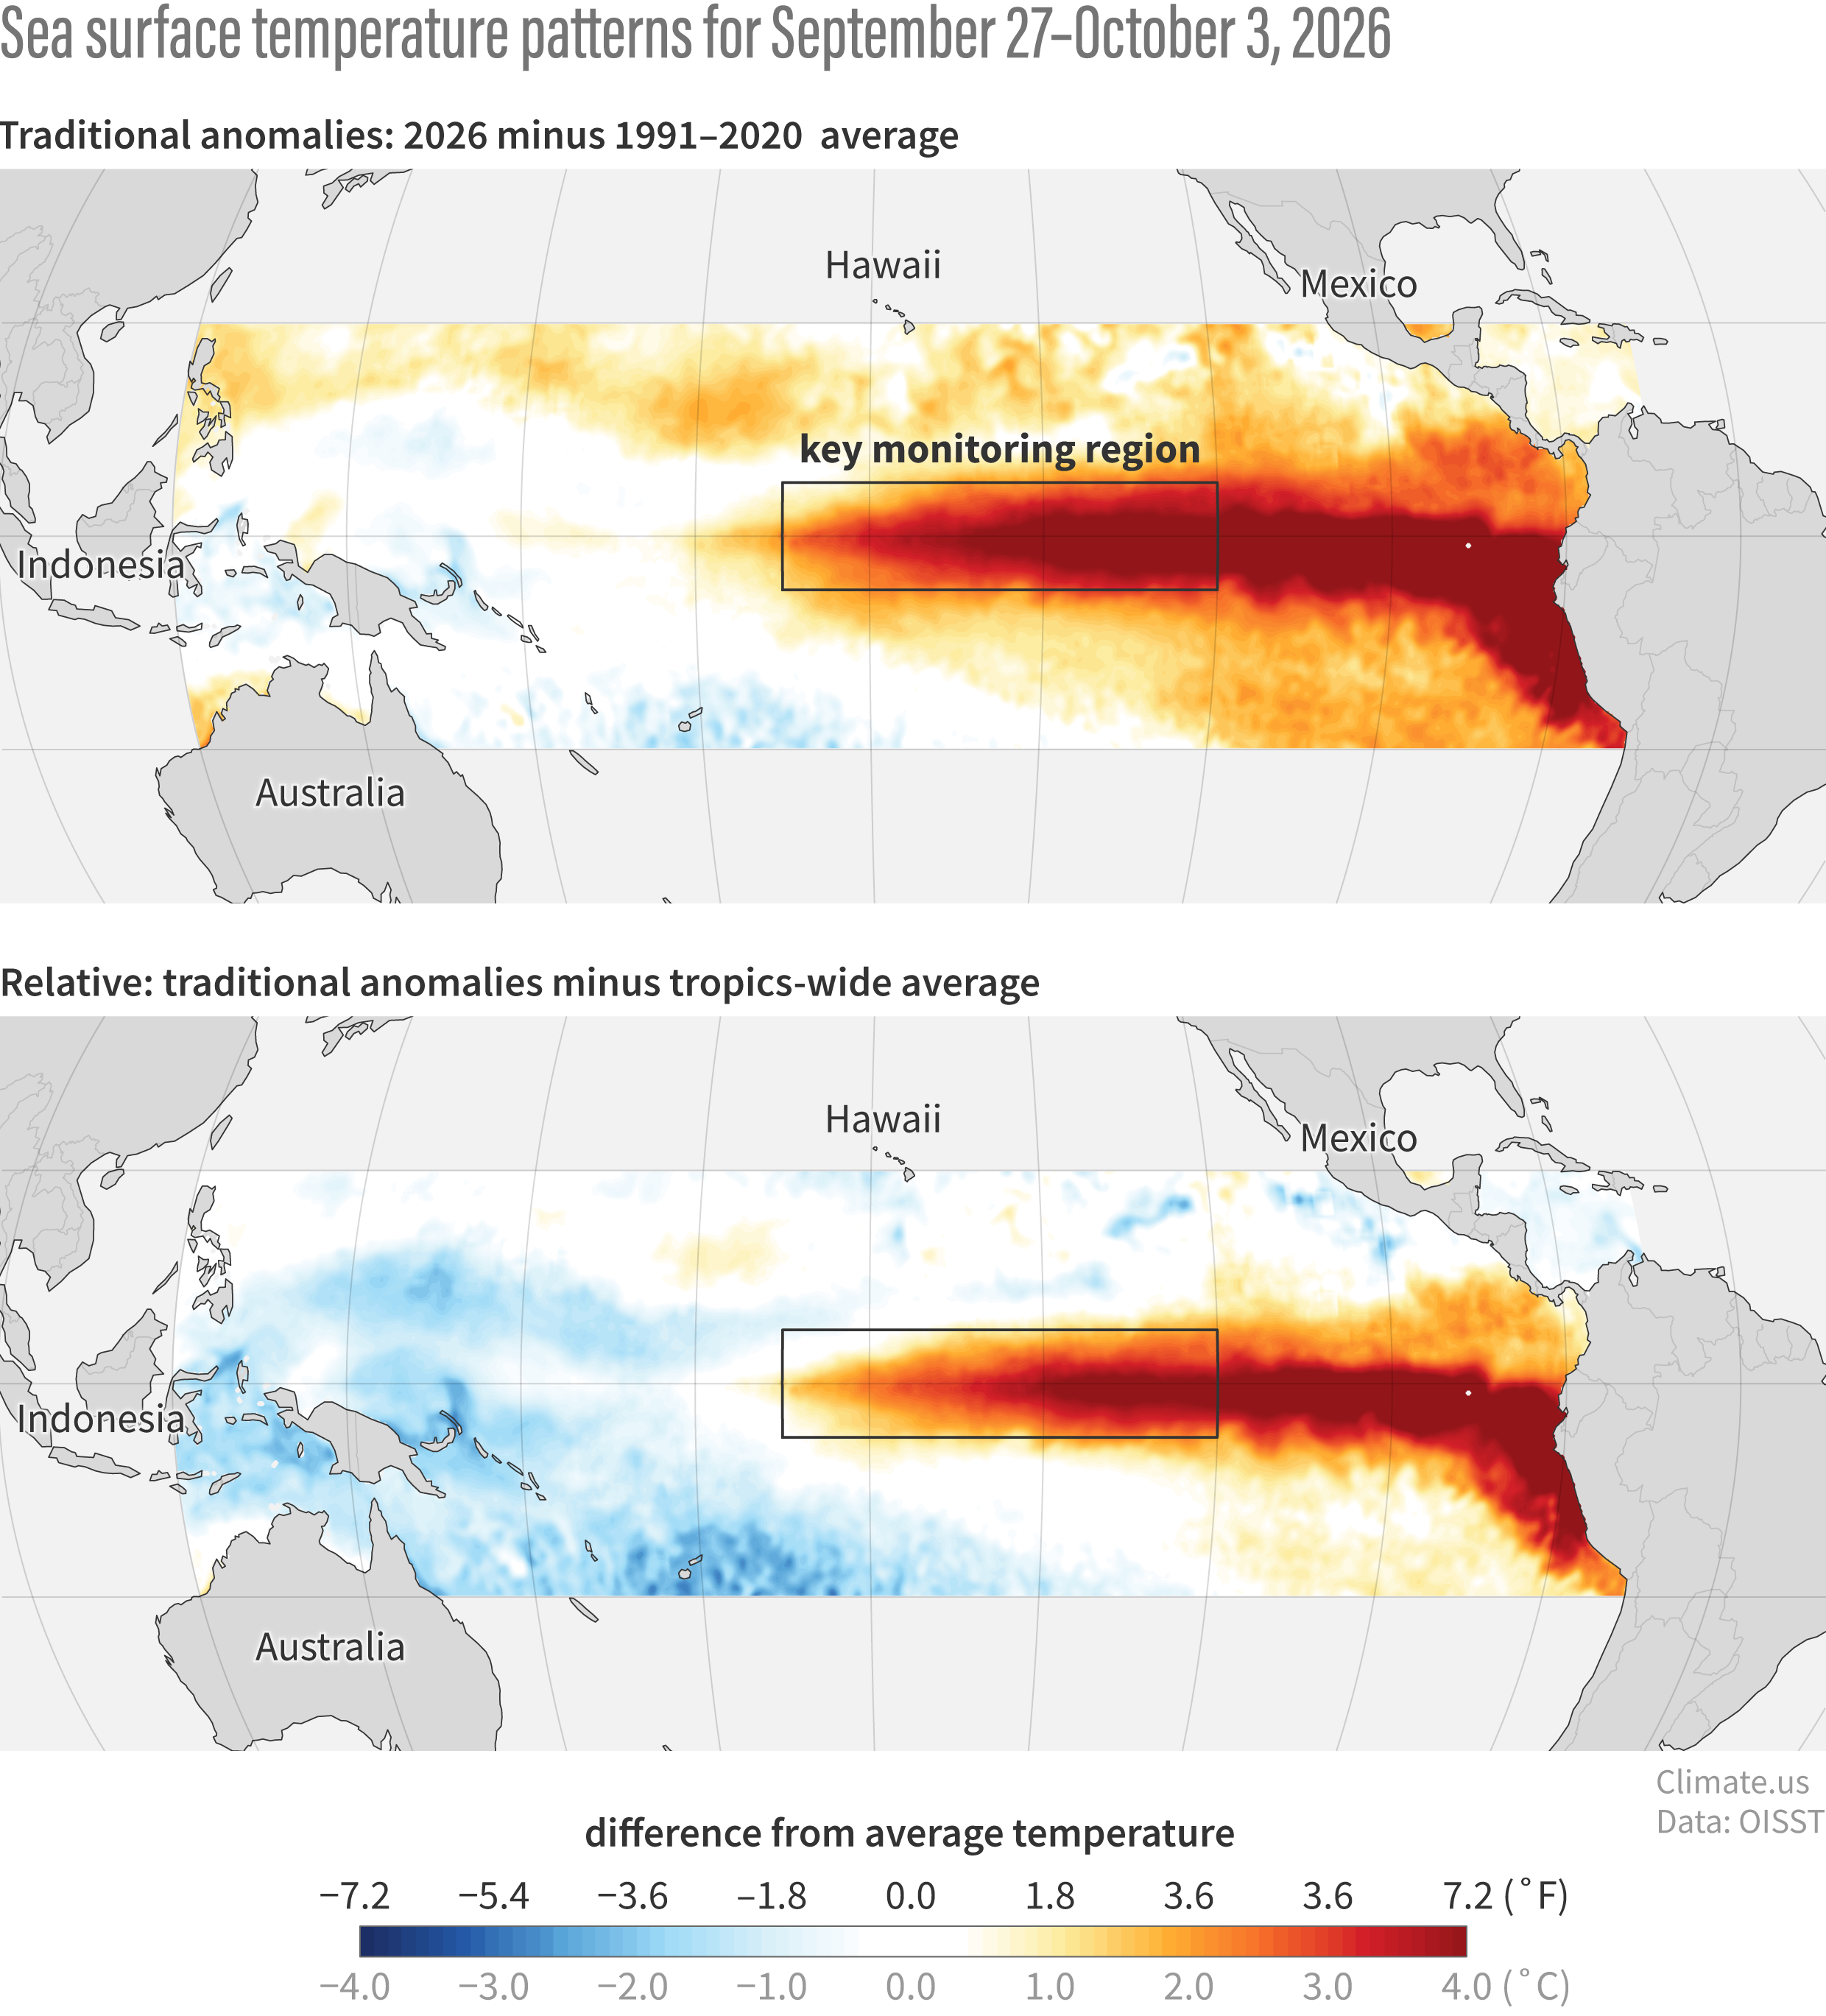
Traditional temperature anomaly (top) and the anomaly relative to the entire tropics (bottom) across the tropical Pacific from September 27–October 3, 2026, compared to the 1991-2020 average. The relative anomaly better shows the difference in temperature across the basin. That cool-to-warm gradient from west-to-east is not normal for the area, and it shifts where rainfall and convection happen. Climate.us maps, based on NOAA OISST data.