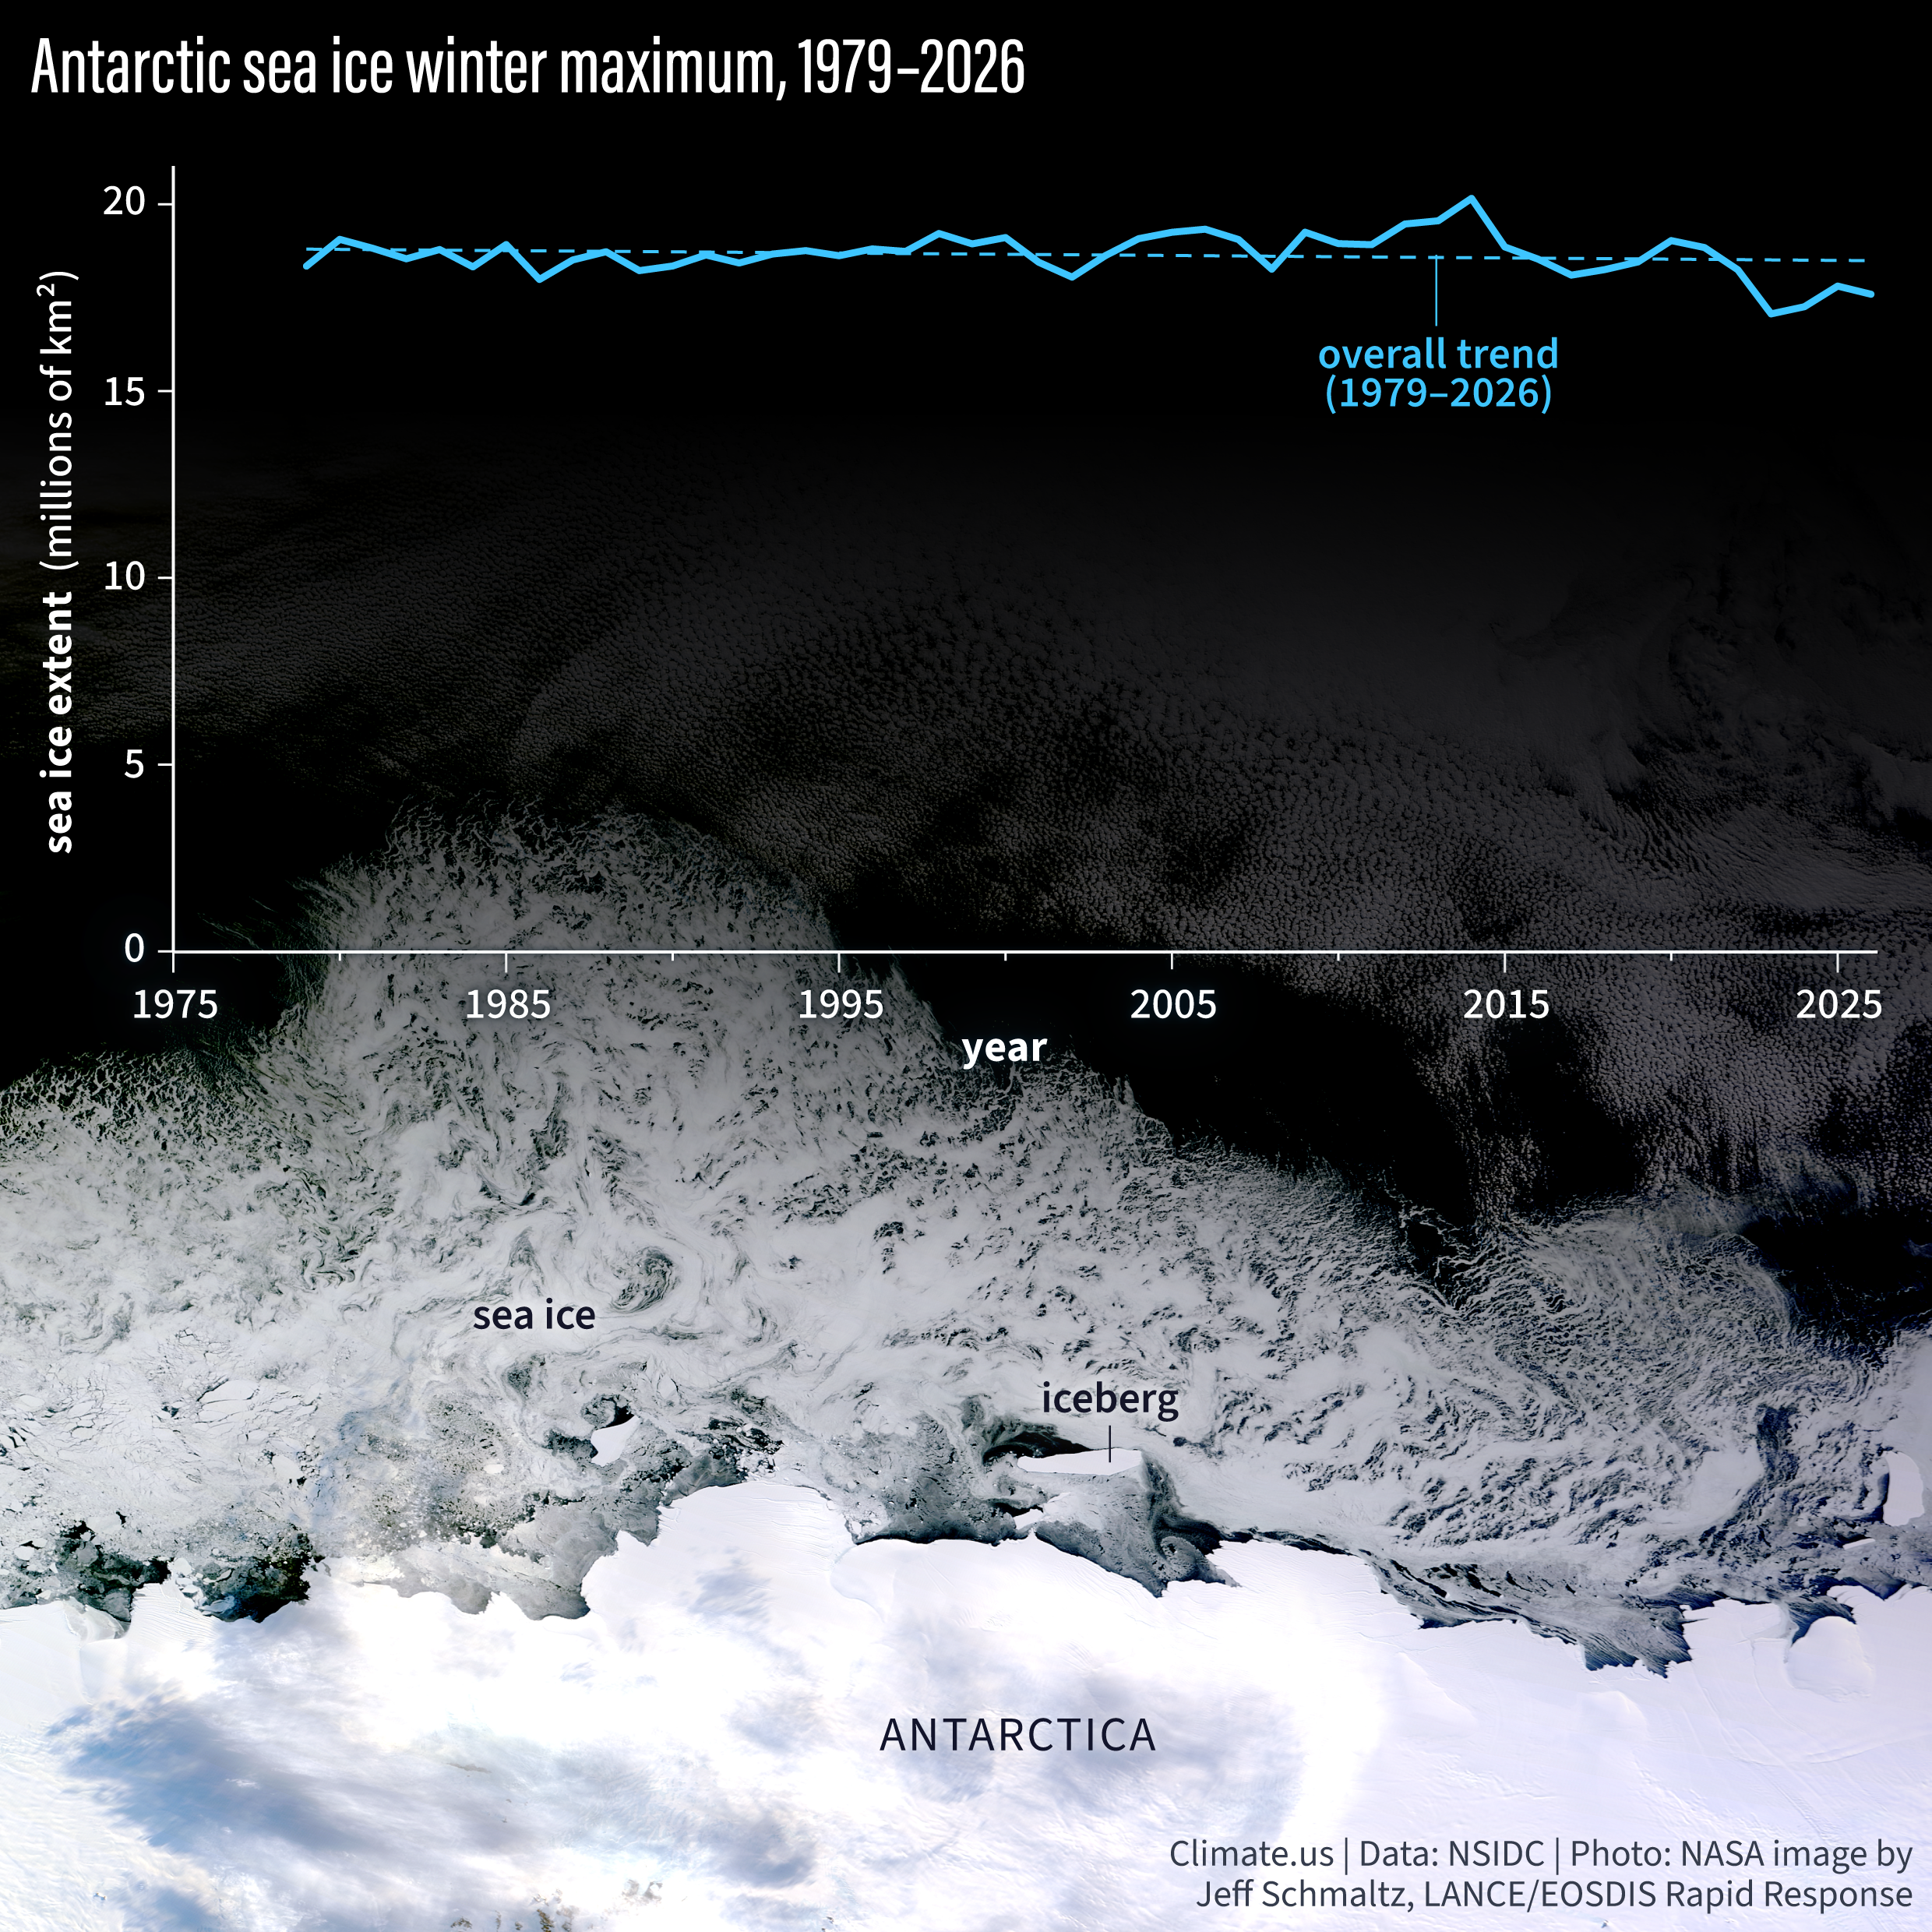
This graph shows each year’s Antarctic sea ice maximum extent (blue line) over 1979–2026 and long-term trend (dashed light blue line) but this trend is not statistically significant. The graph is derived from NSIDC’s Sea Ice Index. Extent is the area of ocean with at least 15 percent sea ice concentration.