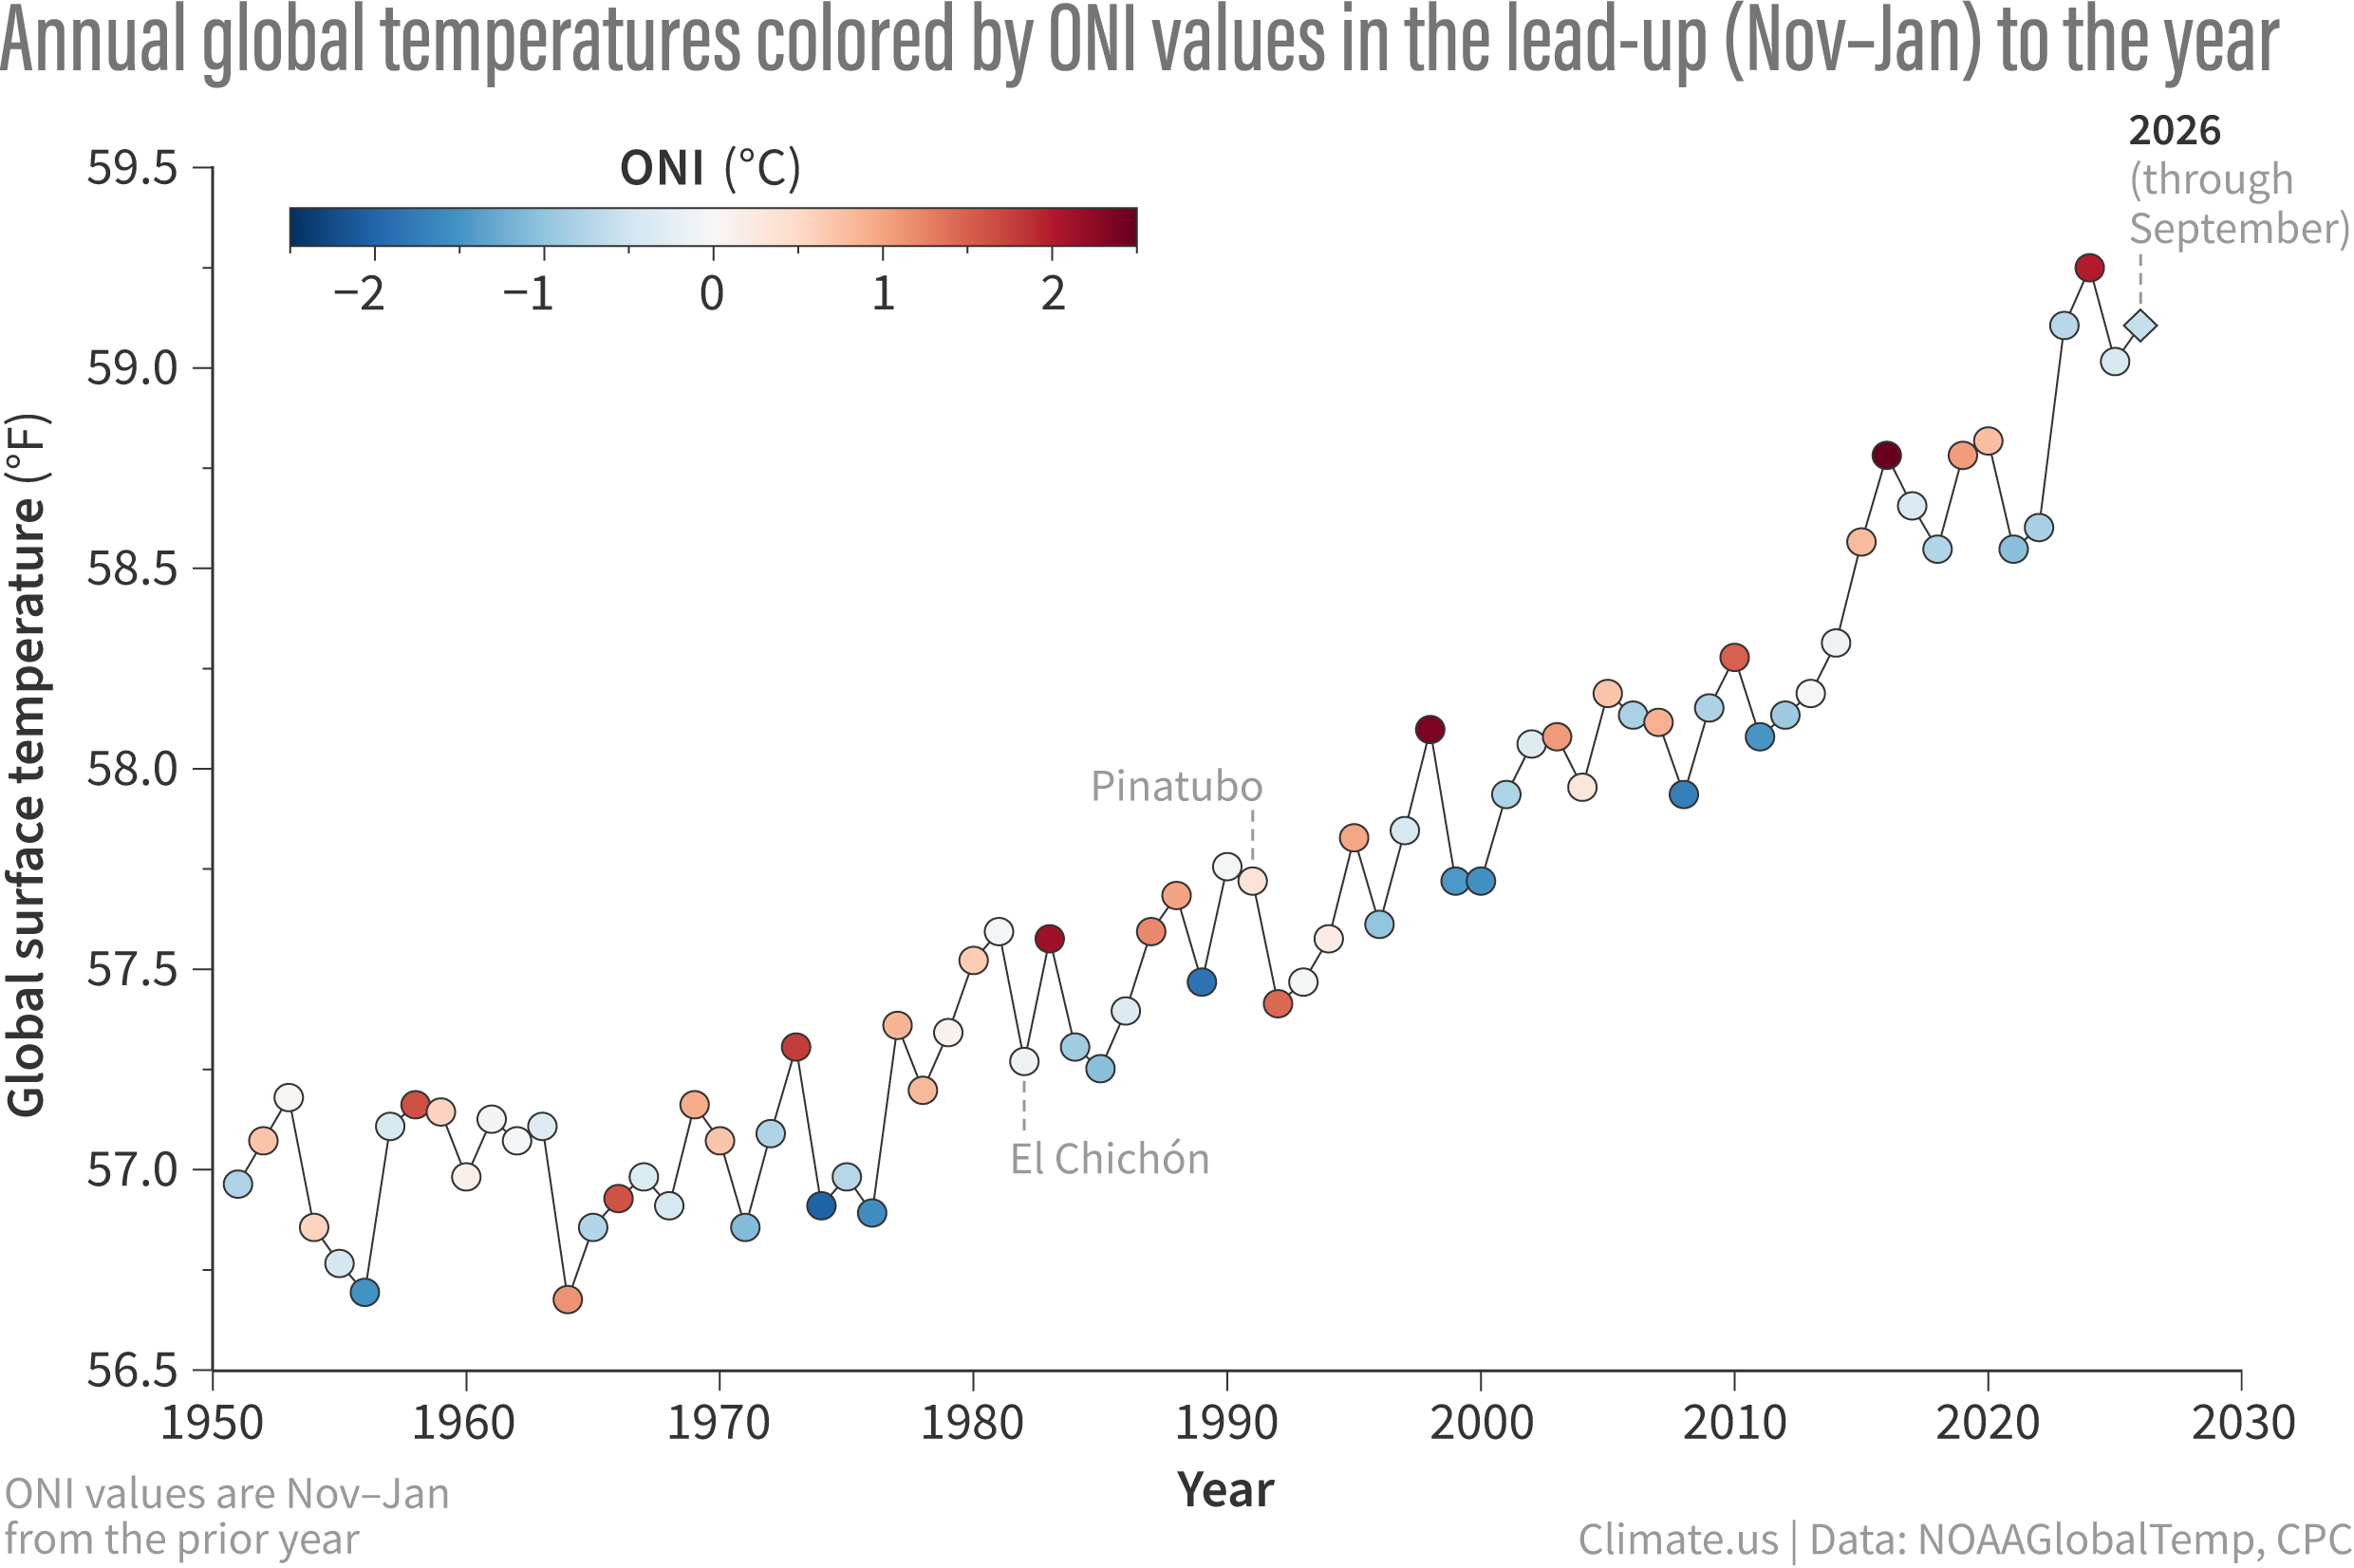
Yearly global surface temperatures (dots) from 1951–2026 (to date, shown by diamond). The dots are colored by the Oceanic Niño Index (ONI) value in the November-January period leading into the year. Dark red means a strong El Niño influence heading into the year; dark blue means a strong La Niña influence. In general, the global average temperature spikes in the year after El Niño first develops. Graph by Emily Becker, based on NOAA temperature and ONI data.