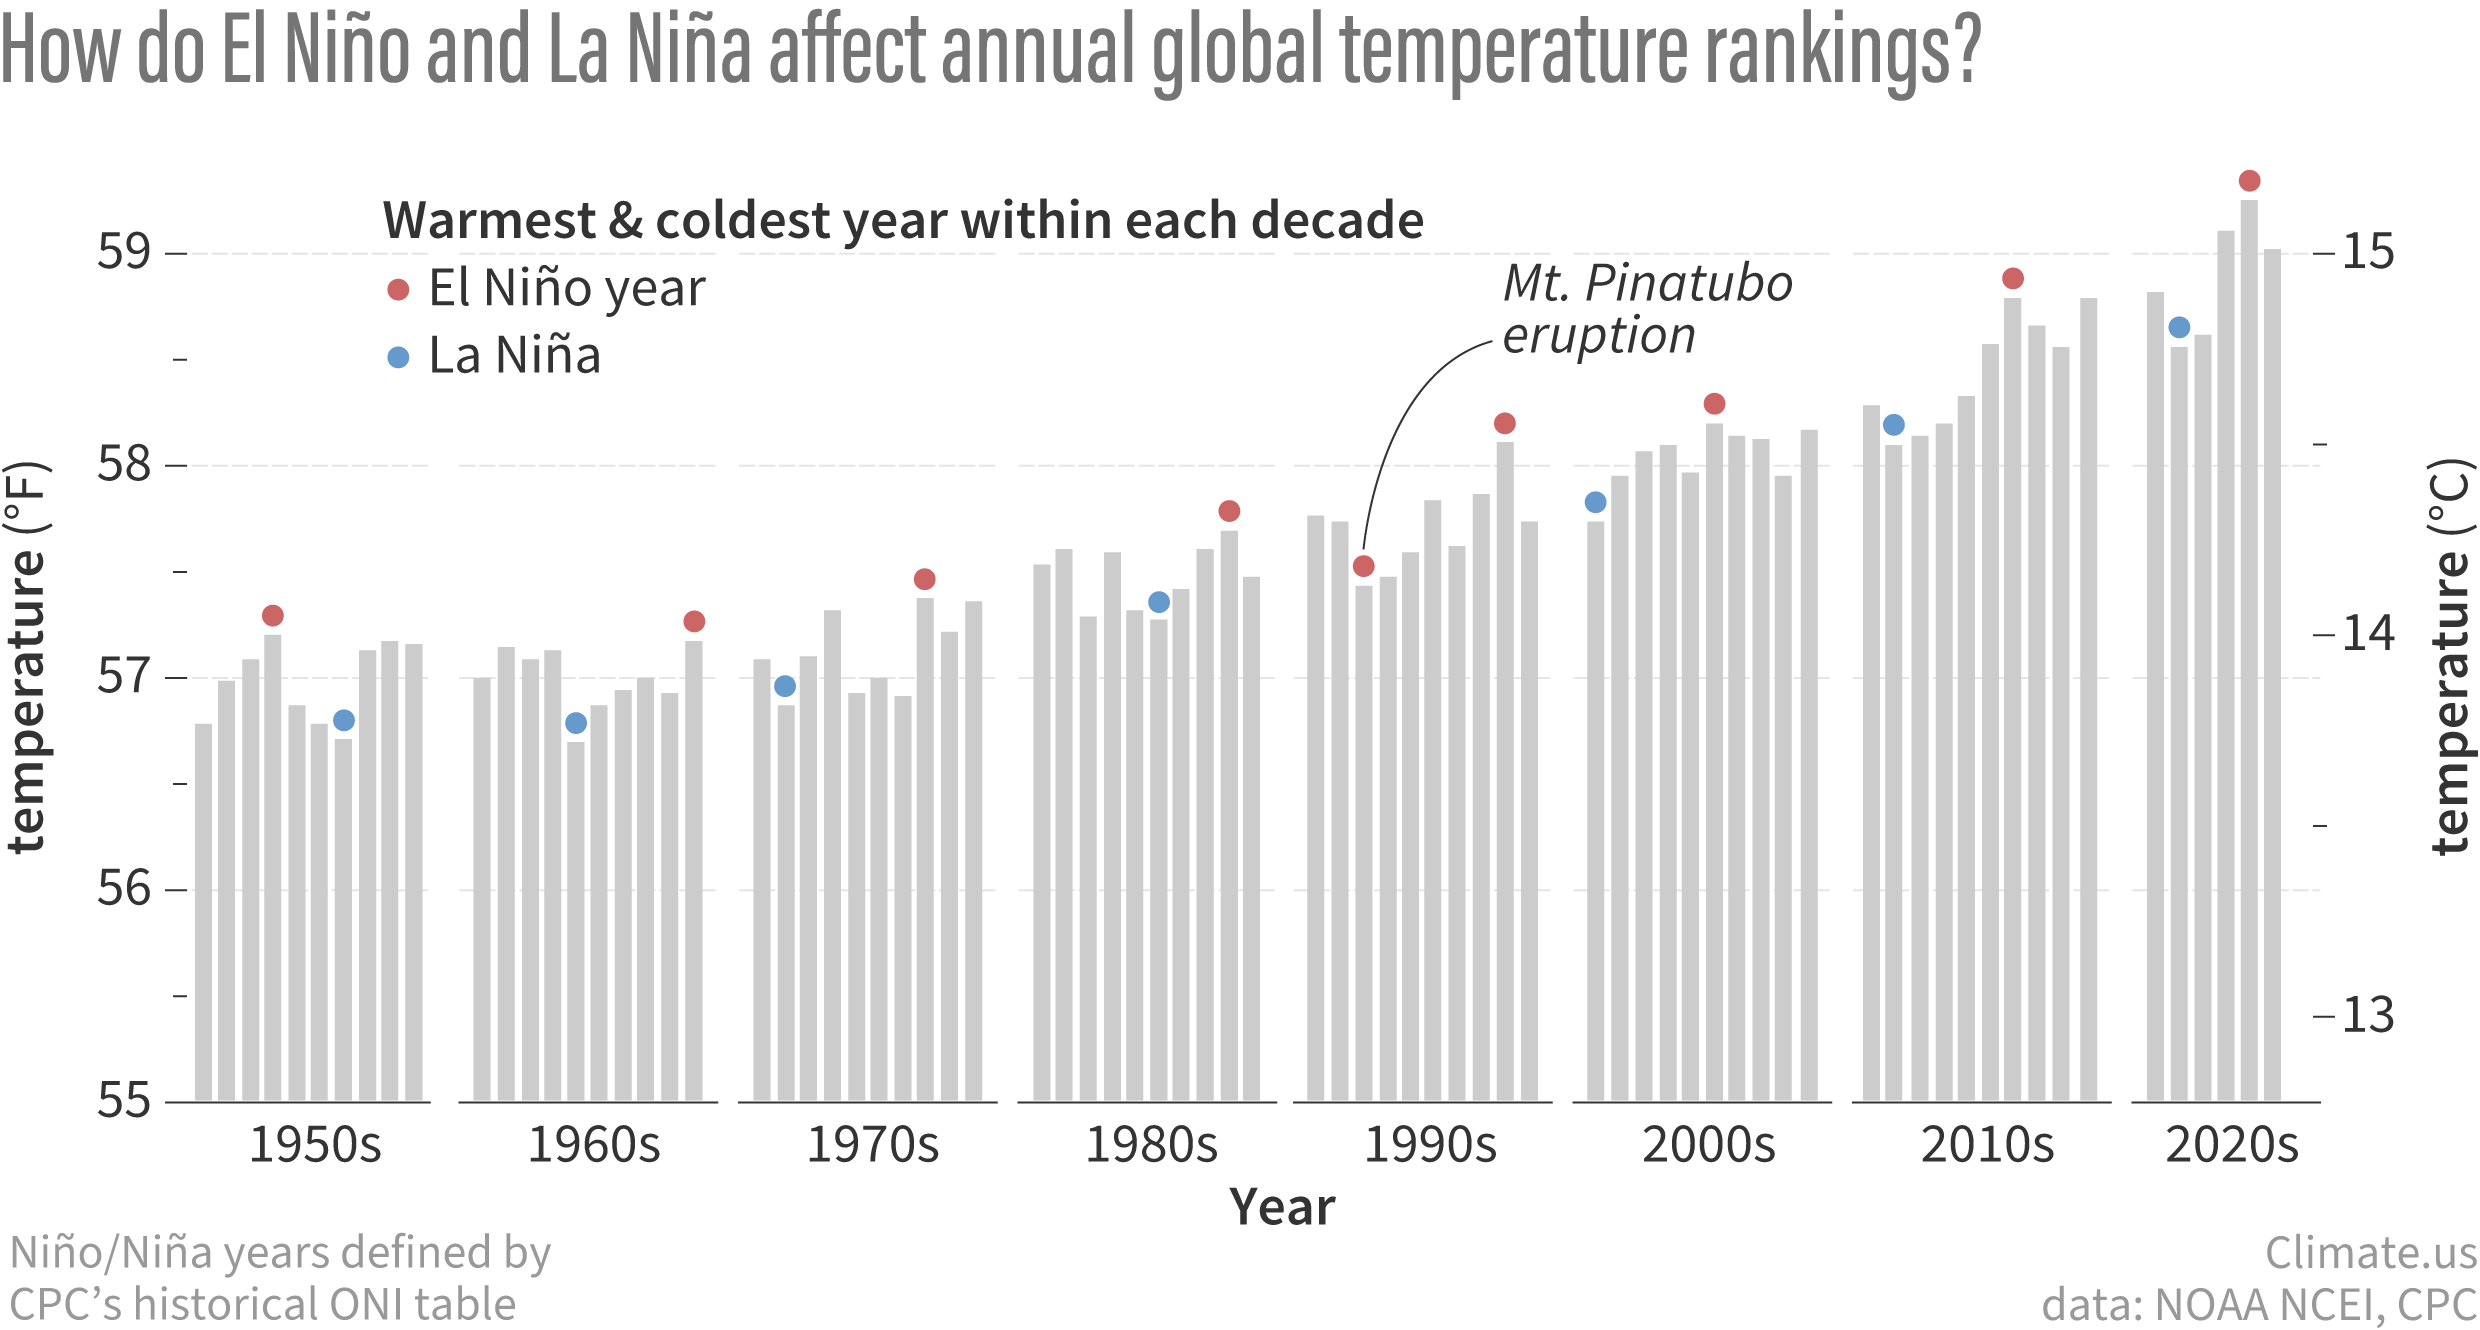
Annual average surface temperatures (gray bars) from 1950 to 2025. The warmest and coldest years of each decade are topped with circles that are colored red if the year was an El Niño year or blue if it was a La Niña year. We considered a year an El Niño/La Niña year if the November-January season leading into the year was labelled as part of a historical episode by NOAA's Climate Prediction Center or if more than half of the months in that year were. Most decades, the warmest year is an El Niño year, and the coldest year is a La Niña year. A notable exception was 1992. It was the coldest year of the 1990s despite being an El Niño year because of cooling from the eruption of Mount Pinatubo in 1991. NOAA Climate.us graph based on data from NOAA National Centers for Environmental Information.