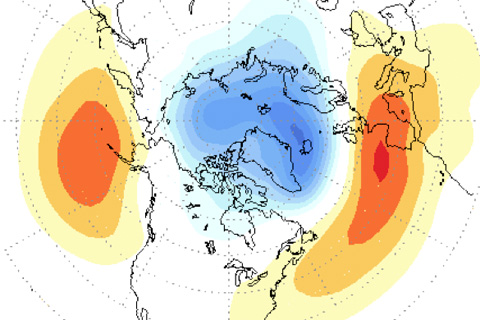
It's not all about ENSO: other important climate patterns impact the United States during the Northern Hemisphere winter season, too.
It's not all about ENSO: other important climate patterns impact the United States during the Northern Hemisphere winter season, too.

As the assessment now known as the BAMS State of the Climate report pushes into its third decade, international participation is at an all-time high. From atmospheric chemists to tropical meteorologists, more than 420 authors from institutions in 57 countries contributed to this year's report.
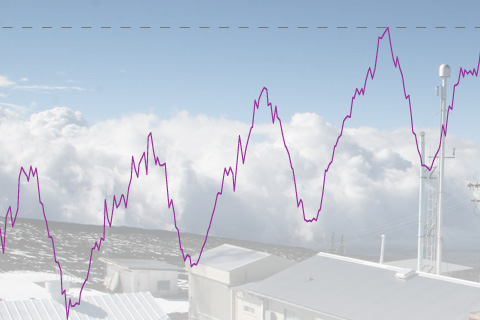
The annual average concentration of carbon dioxide (CO2) in the atmosphere stood at 395.3 parts per million (ppm) in 2013—a 27 percent increase compared to conditions before the Industrial Revolution. On May 9, 2013, the daily average concentration of CO2 surpassed 400 ppm for the first time at the Mauna Loa Observatory in Hawaii.

Super Typhoon Haiyan slammed into the east coast of Samar and Leyte Islands in the Philippines with what may have been the highest recorded wind speed for a tropical cyclone at landfall. Haiyan, locally known as “Yolanda,” was the deadliest typhoon in the country's modern record.
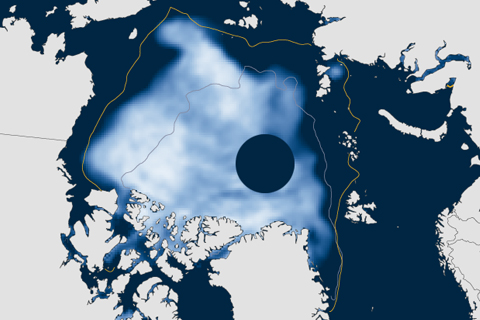
Arctic sea ice extent shrunk down to 2.0 million square miles (5.1 million square kilometers) in September 2013—18 percent below the 1981-2010 average, but larger than record low set in 2012.
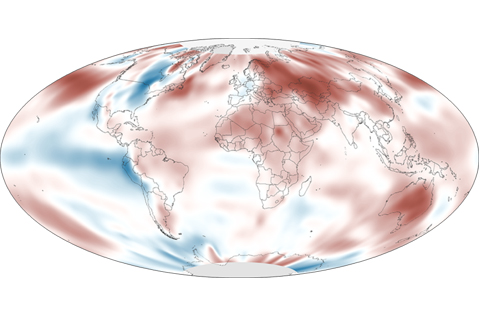
Globally-averaged surface temperature for 2013 was 0.36 - 0.38° Fahrenheit above the 1981–2010 average, placing it among the top 10 warmest years since record-keeping began.
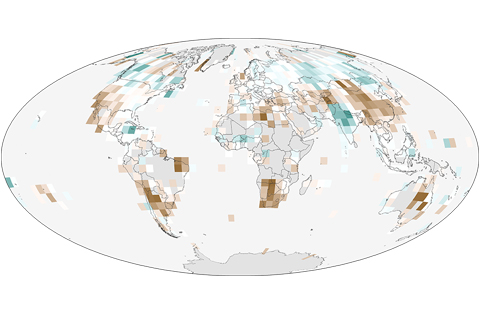
2013 continued a trend of water vapor in the surface atmosphere increasing over land and ocean relative to the 1970s, while the atmosphere over land becomes less saturated.
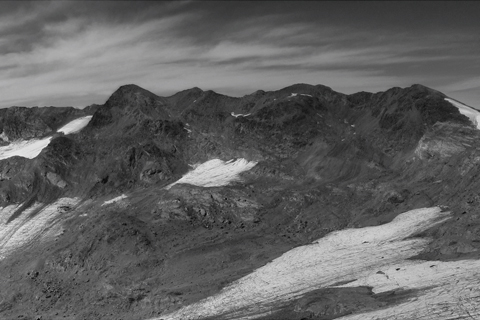
In 2012—for the 23rd consecutive year—mountain glaciers worldwide lost more mass through melting than they gained through new snow accumulation. The retreat of the majority of mountain glaciers worldwide is one of the clearest signs that climate is warming over the long term.
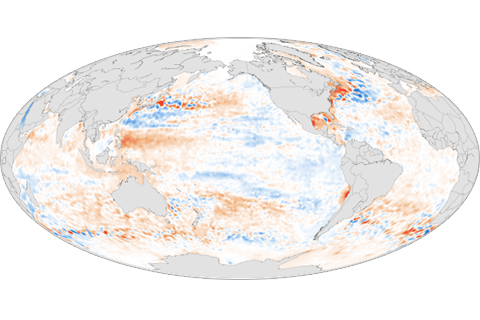
Upper ocean heat content has increased significantly over the past two decades. An estimated 70 percent of the excess heat has accumulated in the top 2,000 feet of the ocean, and the rest has flowed into deeper ocean layers.
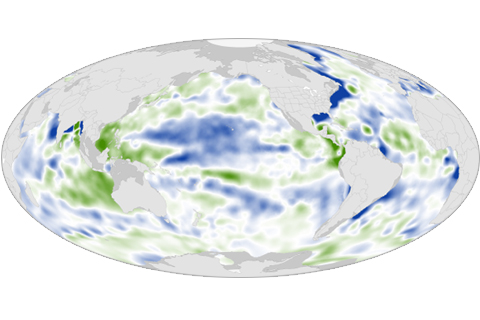
Large-scale patterns of sea surface salinity in 2013 mirrored the overall trend seen from 2004 to 2013: salty, dry areas are becoming increasingly salty, and fresher areas are becoming increasingly fresh.