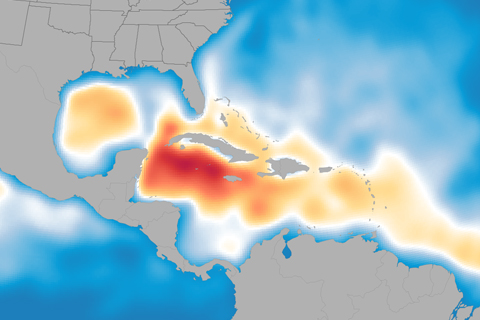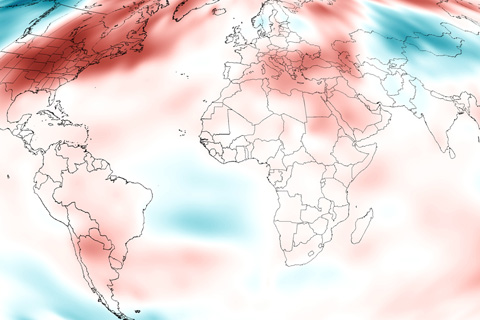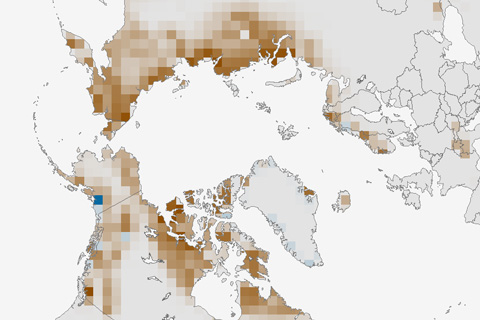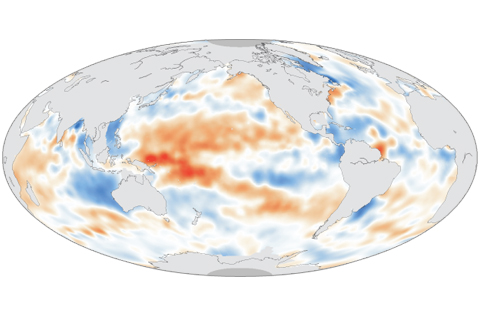
Maps of changes in the saltiness of the surface waters of the ocean over time can reveal natural climate cycles, human-caused changes in evaporation and rainfall, and variation in the strength and location of currents. This map of changes in surface salinity between 2004 and 2012 provides clues to how climate variabiity and change have influenced the global water cycle in the past decade.