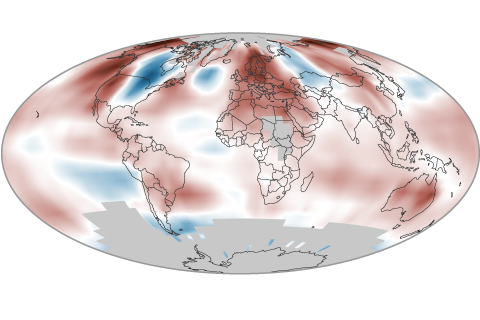
Depending on the data set, 2014 was either the warmest or tied-for-warmest year since records began in the mid-to-late 1800s.
Depending on the data set, 2014 was either the warmest or tied-for-warmest year since records began in the mid-to-late 1800s.
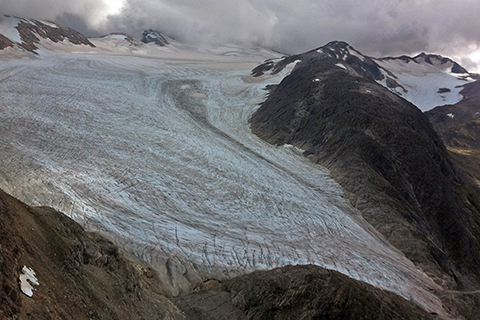
Worldwide in 2014, three dozen reference glaciers experienced an average mass loss equivalent to of 853 millimeters of water equivalent in 2014.
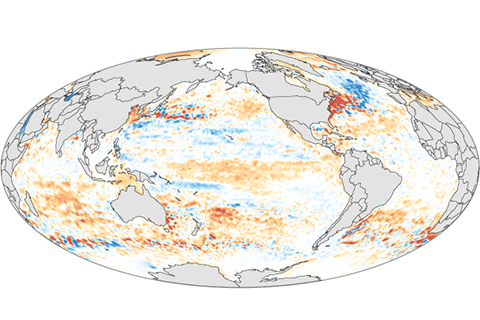
In 2014, the upper ocean held more heat than average throughout most of the major ocean basins.
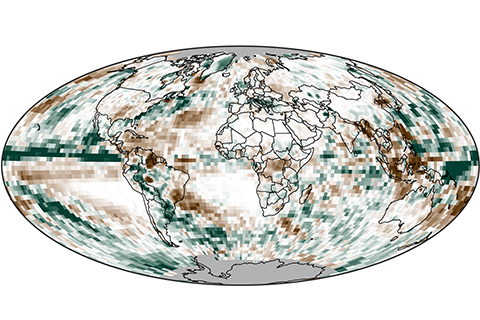
In 2014, precipitation over land was generally below average, while precipitation over the oceans was above average.
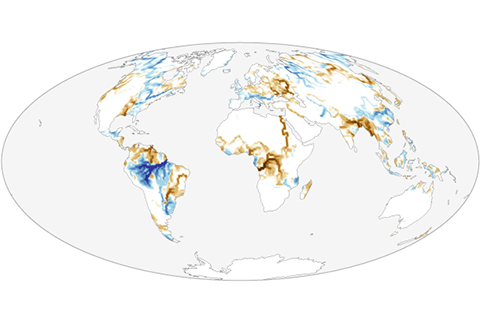
Overall, average global river outflow in 2014 slightly exceeded the climate normal.
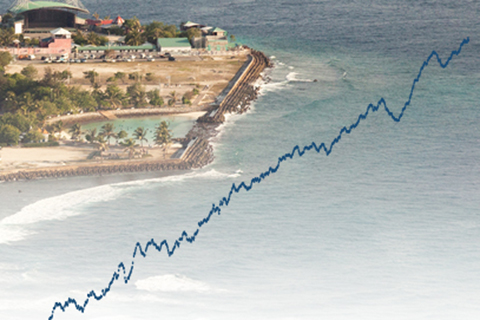
In 2014, global average sea level was 2.6 inches (67 mm) above the 1993 average, which is the highest yearly average in the satellite record.
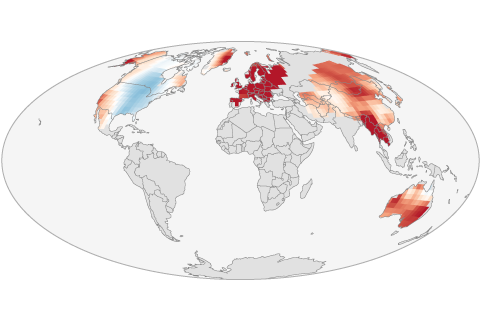
Cool conditions prevailed across large parts of the North America in 2014. Everywhere else, the frequency of warm days was higher than average, and the frequency of cold nights was below average.
In 2014, the most essential indicators of Earth's changing climate continued to reflect trends of a warming planet, with several setting new records. Here are NOAA Climate.gov's highlights from the State of the Climate in 2014 report released online today by the American Meteorological Society (AMS).
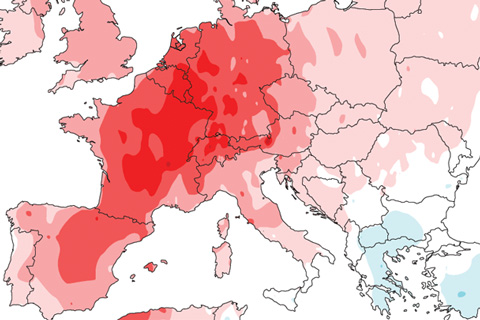
A stagnant weather pattern and plenty of hot air were the necessary ingredients for a record-breaking heat wave in Europe.

El Niño continues to build. What happened during June? What's the forecast? And what does Bruce Lee have to do with anything?