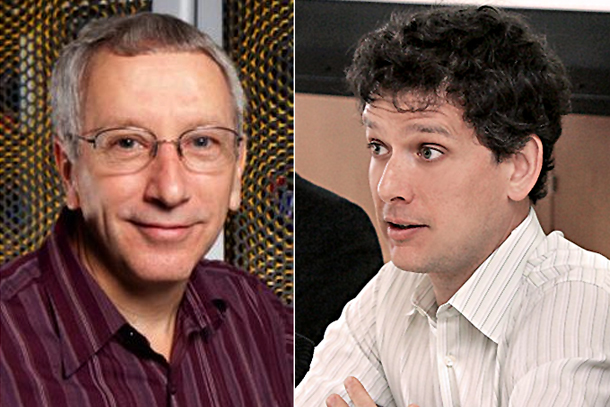
Ron Stouffer and Gabriel Vecchi of NOAA’s Geophysical Fluid Dynamics Laboratory in Princeton, N.J., share their experiences working on one of the most comprehensive scientific documents in history.
Ron Stouffer and Gabriel Vecchi of NOAA’s Geophysical Fluid Dynamics Laboratory in Princeton, N.J., share their experiences working on one of the most comprehensive scientific documents in history.
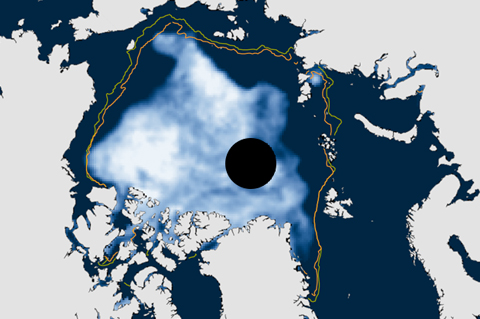
To be consistent with NOAA's use of 30-year periods for the official "climate normals," the National Snow and Ice Data Center switched its baseline period for sea ice analyses from 1979-2000 to 1981-2010. Compared to the new normal, the low ice conditions of the recent past will appear less abnormal than they used to.
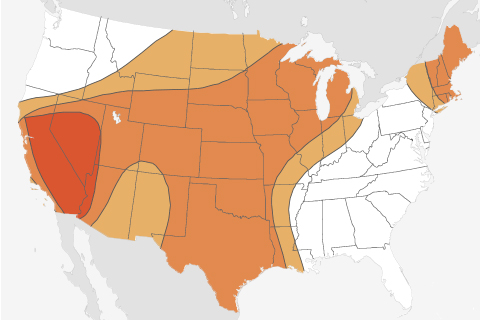
In brief A huge swath of the contiguous United States has a heightened chance of experiencing well above normal temperatures during October, according to NOAA’s Climate Prediction Center. More…
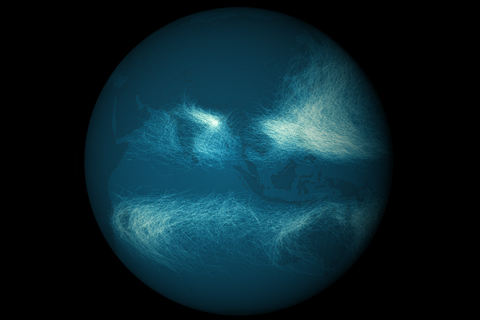
Maps of the thousands of storms that have passed through the Eastern Hemisphere tropical oceans in the past century or so reveal a more crowded landscape than similar maps of the Western Hemisphere. Unlike the Western Hemisphere, where storms are mostly confined to areas north of the equator, the Eastern Hemisphere sees storms in both north and south tropical waters.
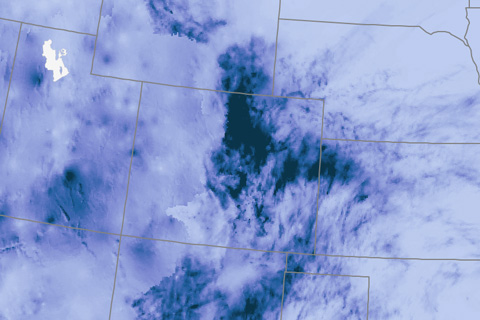
Through the first week of September 2013, Colorado was exceptionally warm and dry. By September 12, everything had changed.
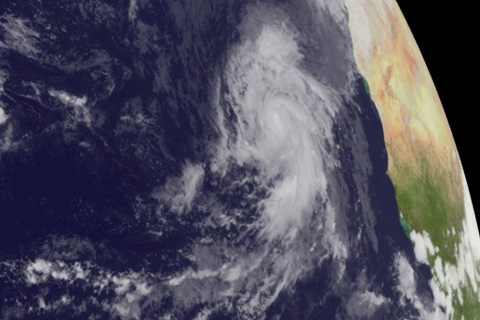
Each fall forecasters spend a couple months re-hashing the season, assessing how well the outlook matched the season as a whole, and trying to isolate any new climate factors that could help them better forecast seasonal activity. Only when the season is complete can they determine if the unusual August weather had a significant impact on the overall hurricane season.
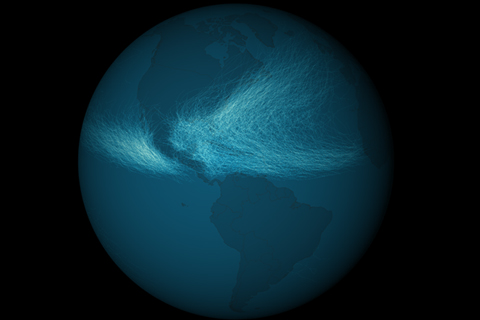
Where are the best places to live if you are looking to avoid tropical cyclones? By mapping out data from the IBTrACS historical storm database, we can see where tropical cyclones make landfall most…
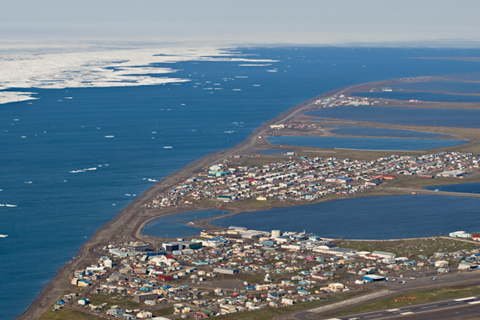
Since 2002, Octobers in Barrow, Alaska—America's northernmost town—are regularly near the warmest on record, thanks to the retreat of sea ice. The warming hinders traditional hunting activities, makes the town more vulnerable to storm surge flooding, and thaws the frozen ground to greater depths, which destabilizes roads, house foundations, and traditional underground freezers.
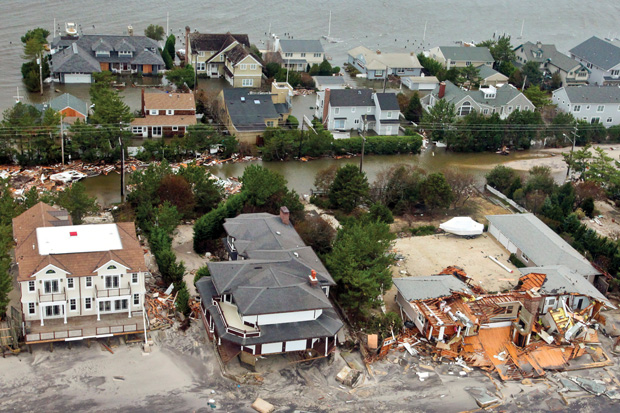
Understanding how extreme events in 2012 were influenced—or not—by human-caused climate change
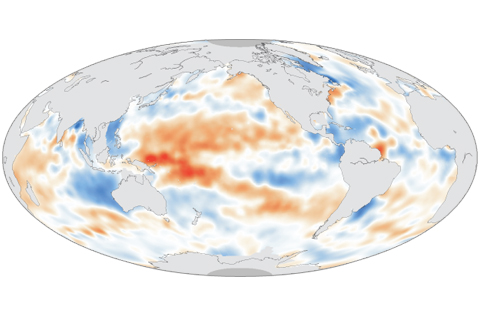
Maps of changes in the saltiness of the surface waters of the ocean over time can reveal natural climate cycles, human-caused changes in evaporation and rainfall, and variation in the strength and location of currents. This map of changes in surface salinity between 2004 and 2012 provides clues to how climate variabiity and change have influenced the global water cycle in the past decade.