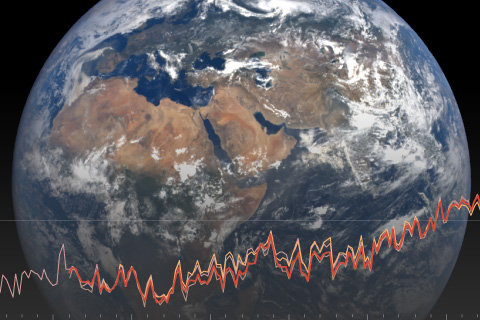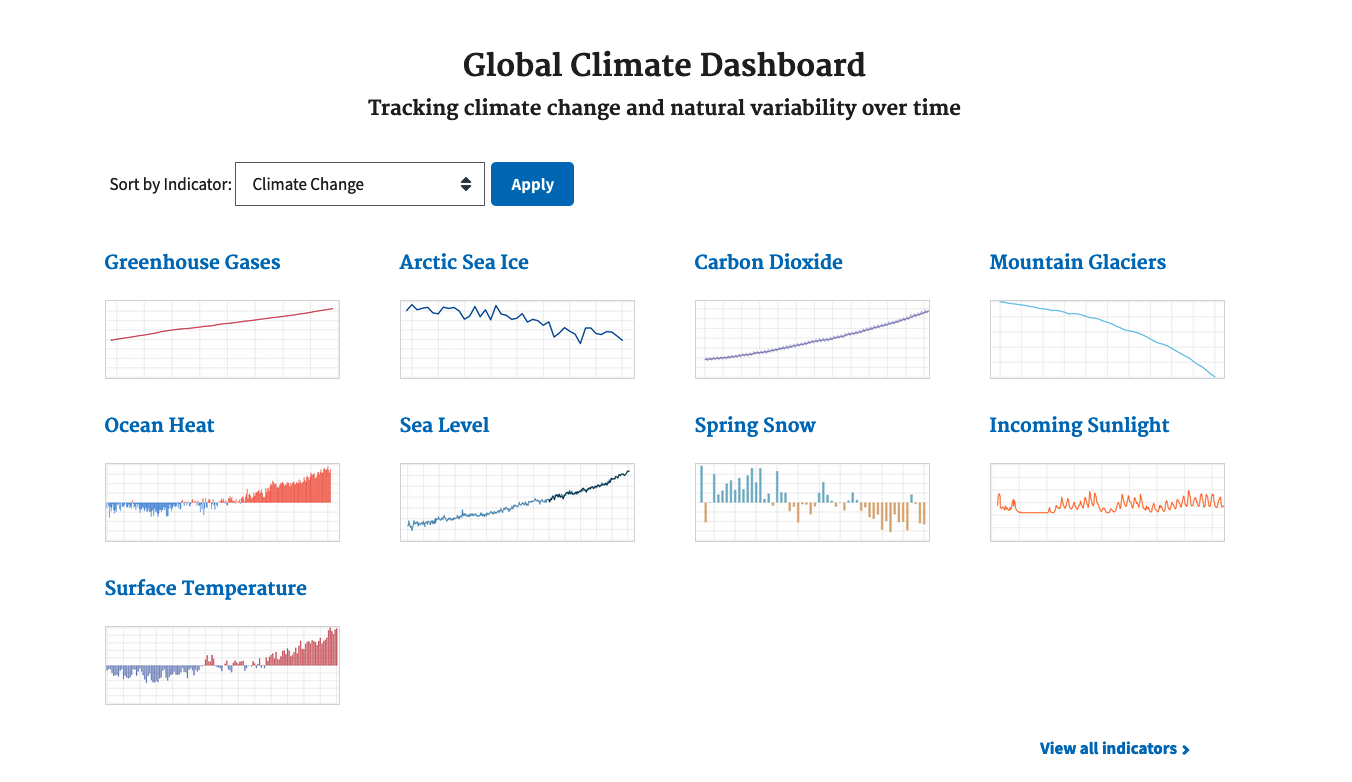
The Global Climate Dashboard provides one-stop access to information, maps, and graphs of key indicators of our global climate. Interactive graphs provide a system-wide view of the state of natural patterns like El Niño and the Arctic Oscillation and those linked to human-caused climate change, such as sea level rise and greenhouse gases.