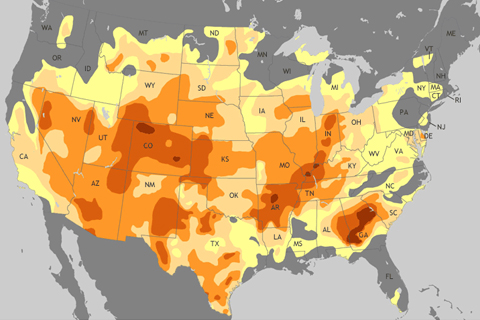
In early July 2012, conditions throughout most of the contiguous 48 states ranged from abnormally dry to exceptional drought.
In early July 2012, conditions throughout most of the contiguous 48 states ranged from abnormally dry to exceptional drought.
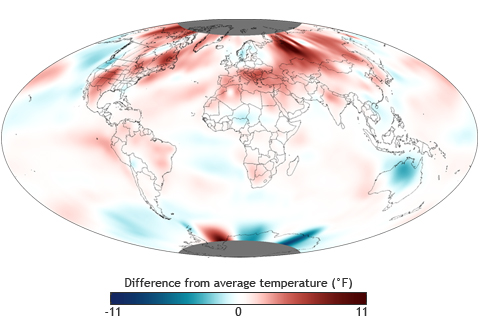
The average global temperature for June 2012 was the fourth highest for any June since record keeping began in 1880. Land-only surface temperatures were the highest on record for the month. June 2012 also marks the 36th consecutive June and 328th consecutive month with a global temperature above the twentieth-century average. The last June with below-average global temperatures was June 1976.
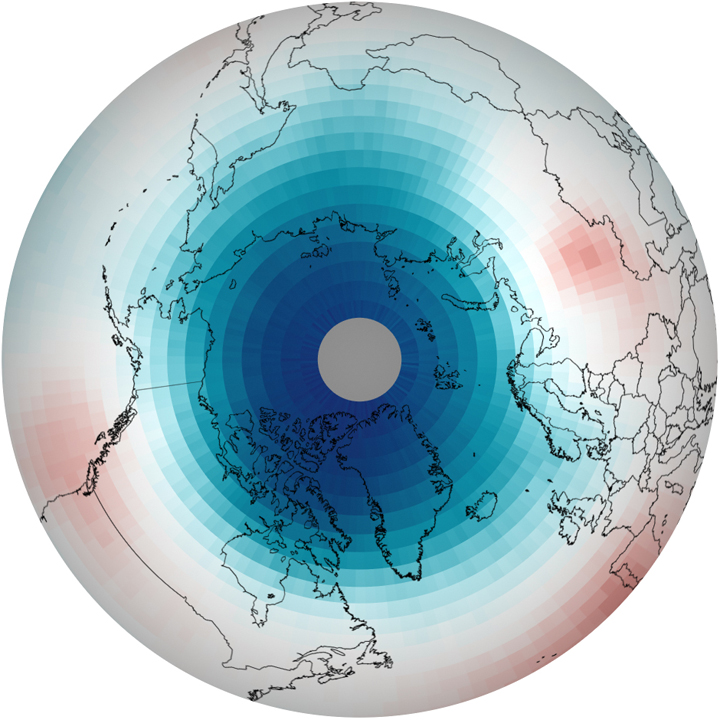
In the spring of 2011, scientists observed the largest, most severe ozone destruction ever witnessed in the Arctic since records began in 1978, due in part to the fact that CFCs stick around in the atmosphere for a very long time. Climate maps reveal the cause to be unusually persistent cold temperatures.
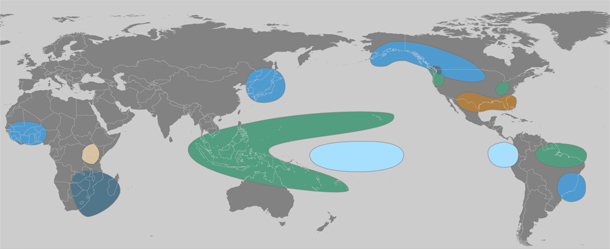
The lead character in the 2011 climate story was La Niña—the cool phase of the El Niño-Southern Oscillation—which chilled the central and eastern tropical Pacific at both the start and the end of the year. These natural cooling events have a long reach: many of the big climate events of 2011, including famine-inducing drought in East Africa, an above-average hurricane season in the Atlantic, and record rainfall in many parts of Australia, are common “side effects” of La Niña.
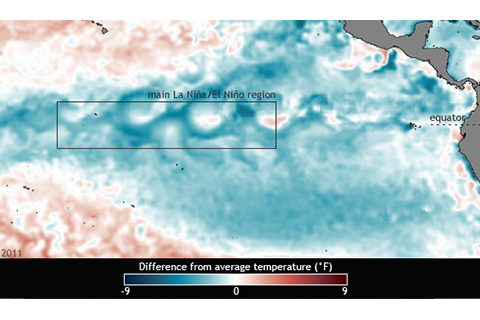
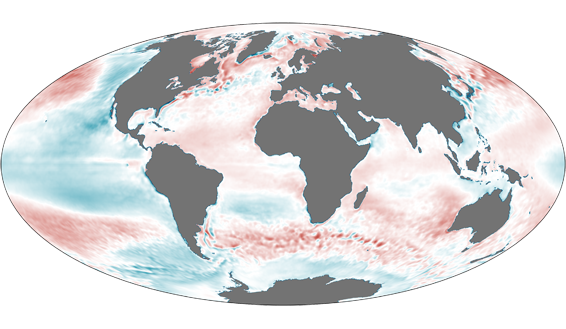
La Niña—the cool phase of the El Niño-Southern Oscillation—dominated the Pacific Ocean at the start of 2011, subsided in summer, and returned in fall.
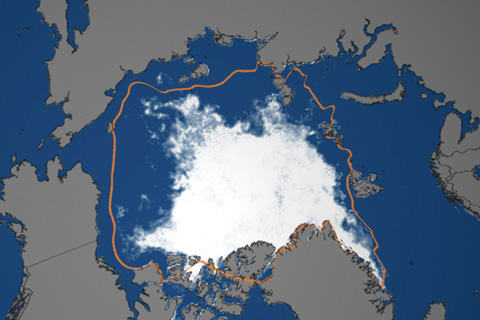
In September 2011, Arctic sea ice reached its second-lowest minimum extent in the satellite record.
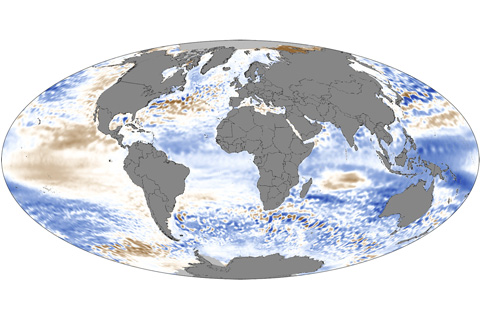
In 2011, global sea levels fell below the long-term trend of sea level rise, but as La Niña waned late in the year, global ocean levels began rising rapidly.
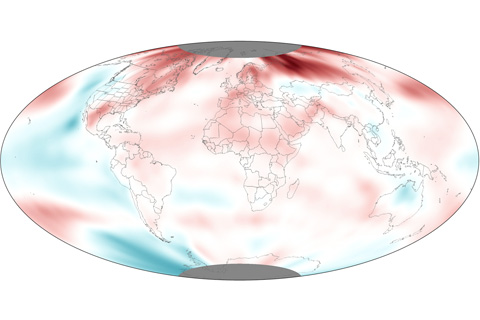
Despite the double-dip La Nina that occurred throughout the year, 2011 was still among the 15 warmest years on record. Including the 2011 temperature, the rate of warming since 1971 is now between 0.14° and 0.17° Celsius per decade (0.25°-0.31° Fahrenheit), and 0.71-0.77° Celsius per century (1.28°-1.39° F) since 1901.
Each year, following months of number crunching and fact-checking, hundreds of climate and earth scientists contribute to a global-scale evaluation of climate and environmental conditions over the previous year. This analysis--our planet's annual check up--is known as the State of the Climate report. Highlights of the 2011 State of the Climate report include wild weather extremes, a double-dip La Niña, and continued evidence of long-term climate warming.
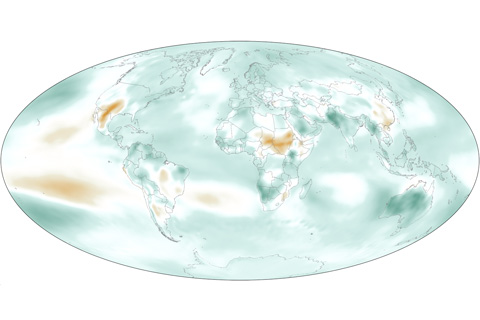
In 2011, Earth’s atmosphere was cooler and drier than it had been the previous year, but it was more humid than the long-term average.