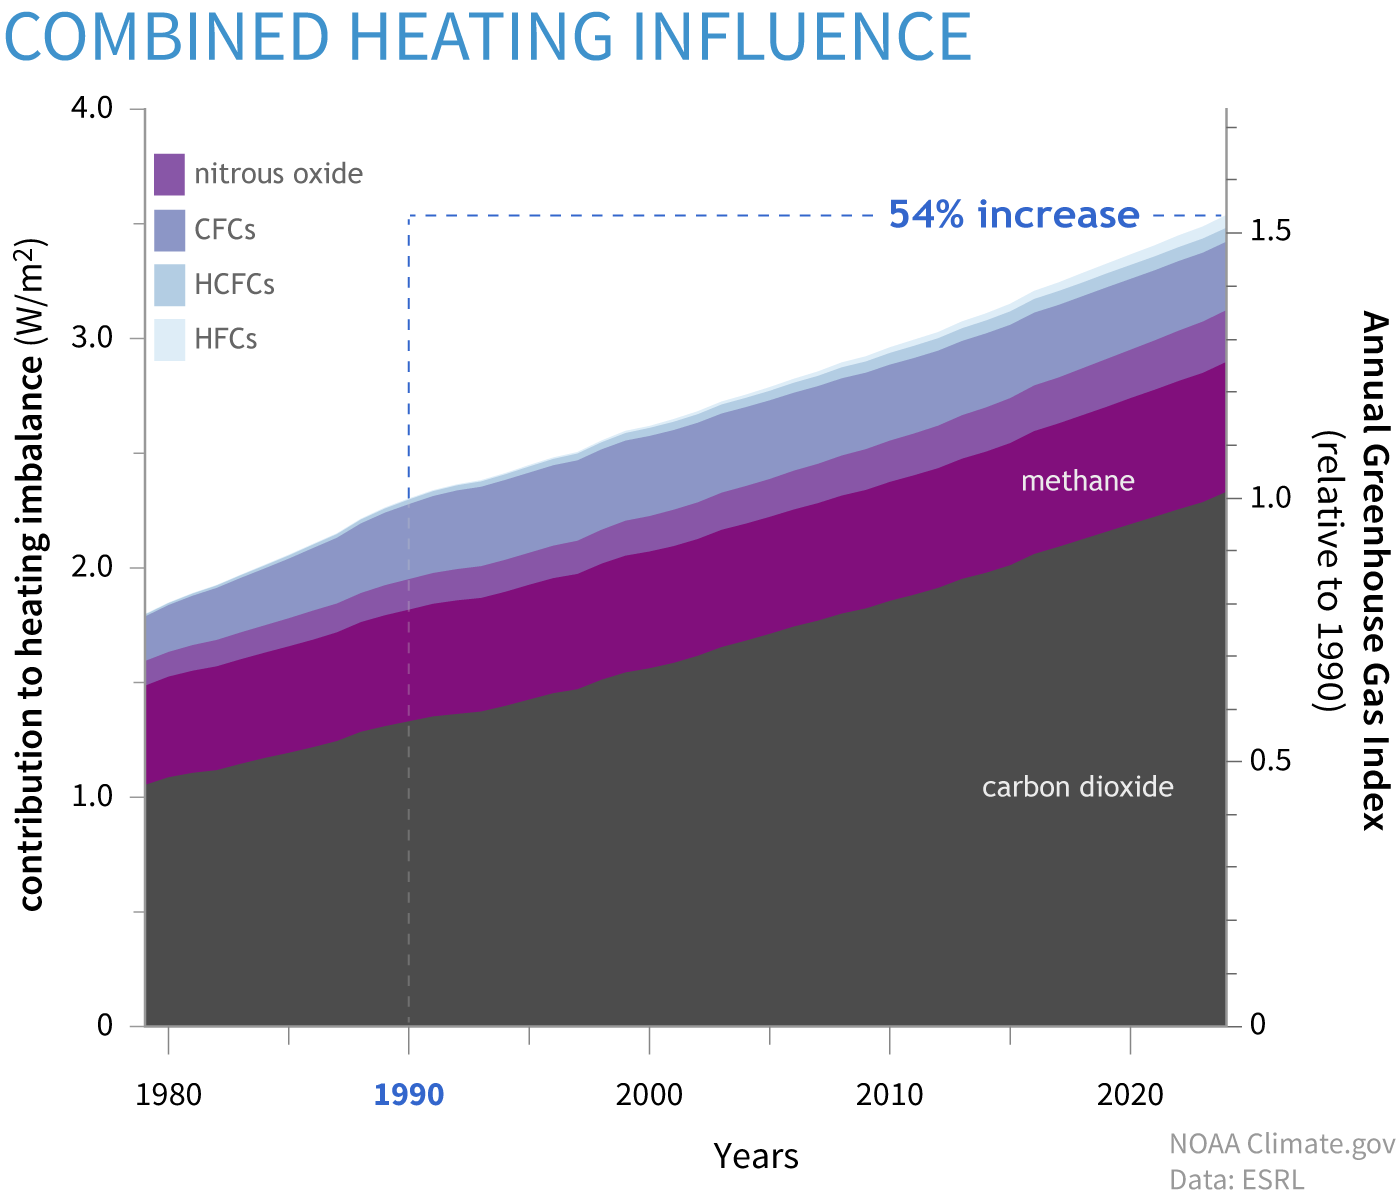
The heating influence of all human-produced greenhouse gases was 54 percent higher in 2024 than it was in 1990.
The heating influence of all human-produced greenhouse gases was 54 percent higher in 2024 than it was in 1990.
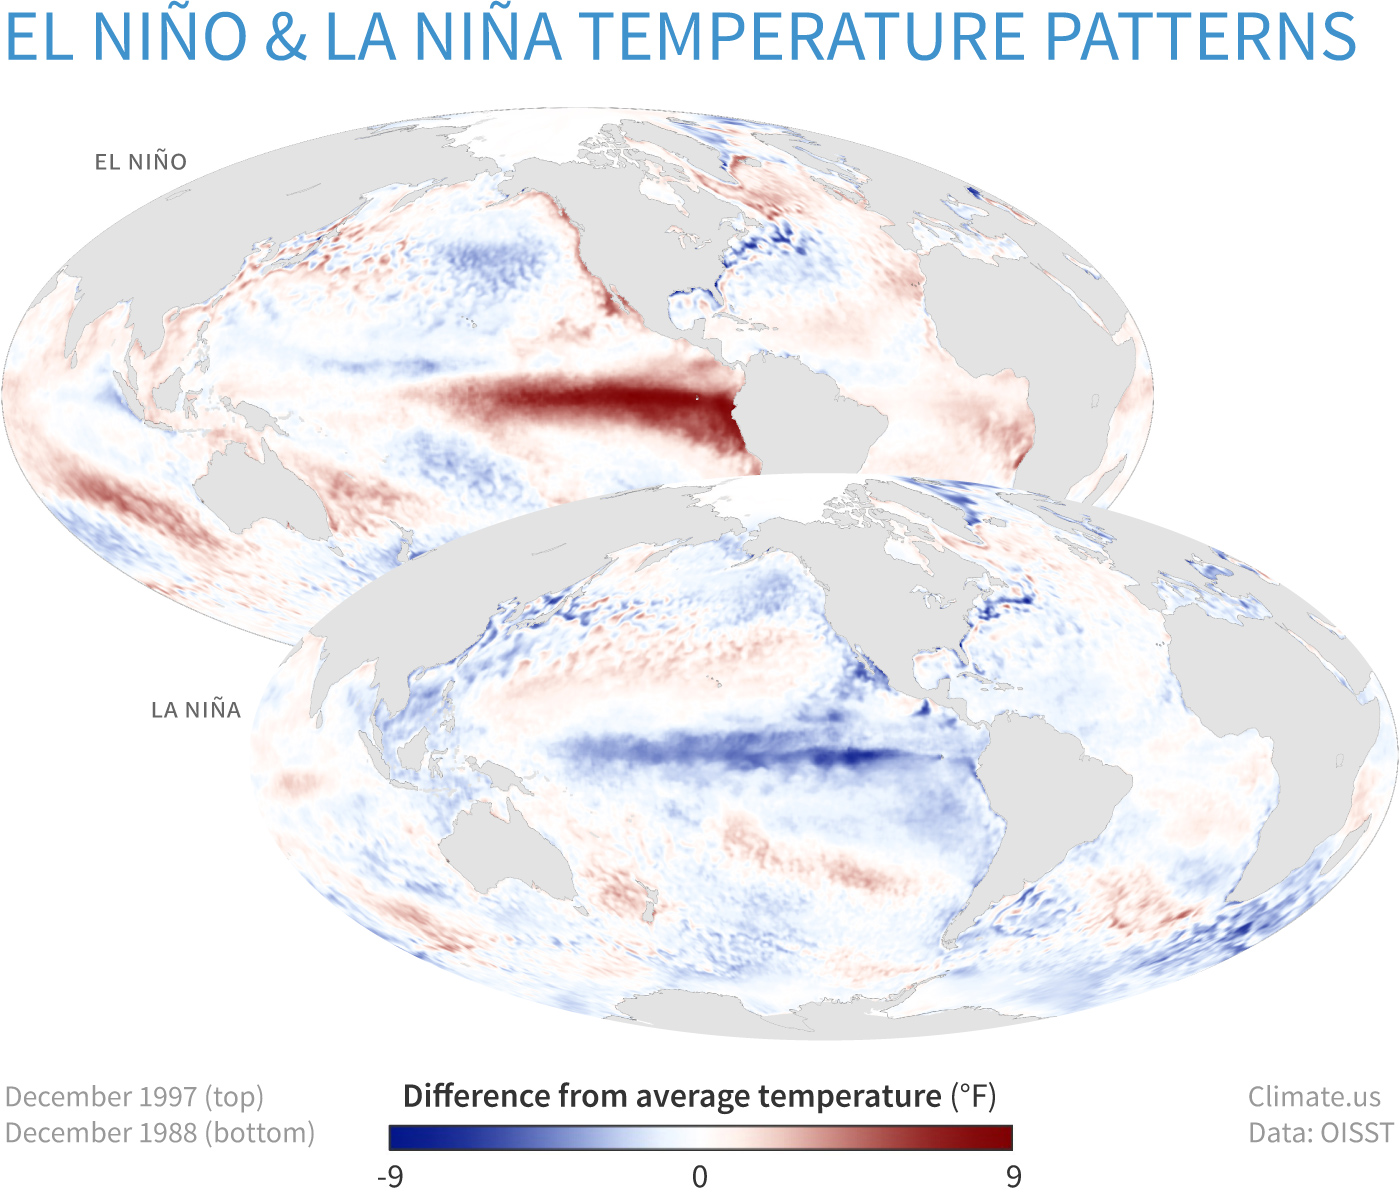
The relative Oceanic Niño Index tracks warming or cooling of the central tropical Pacific Ocean, one indicator of El Niño and La Niña.
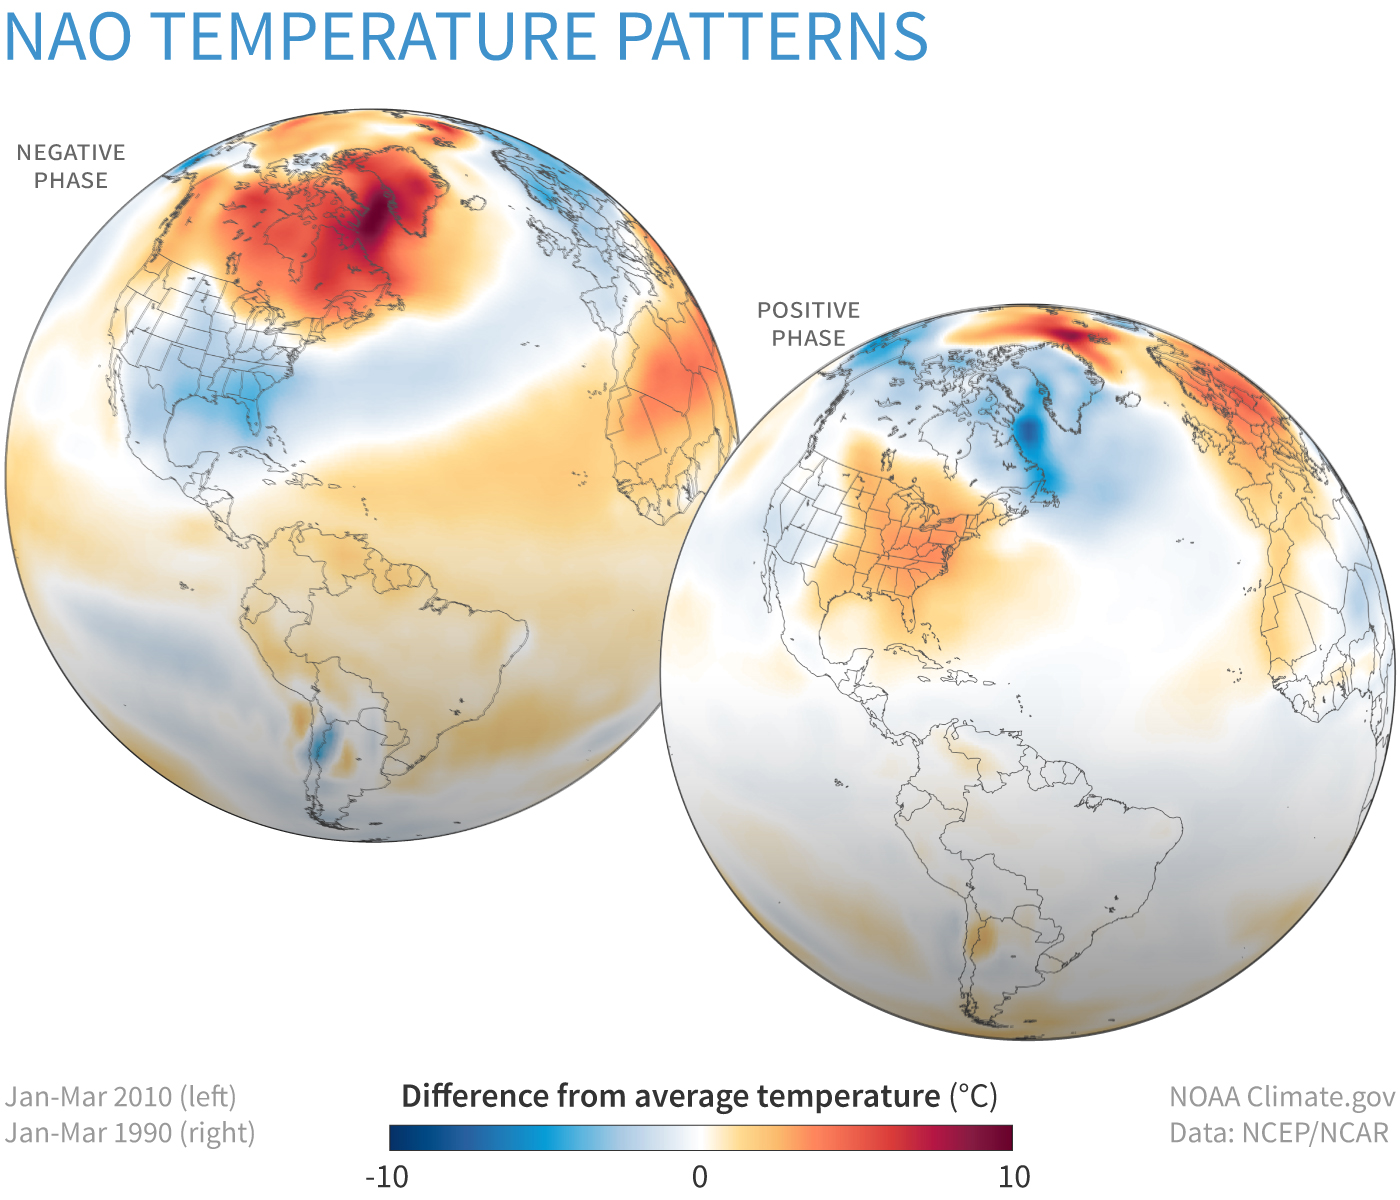
The North Atlantic Oscillation (NAO) index tracks changes in pressure patterns and the jet stream in the North Atlantic.
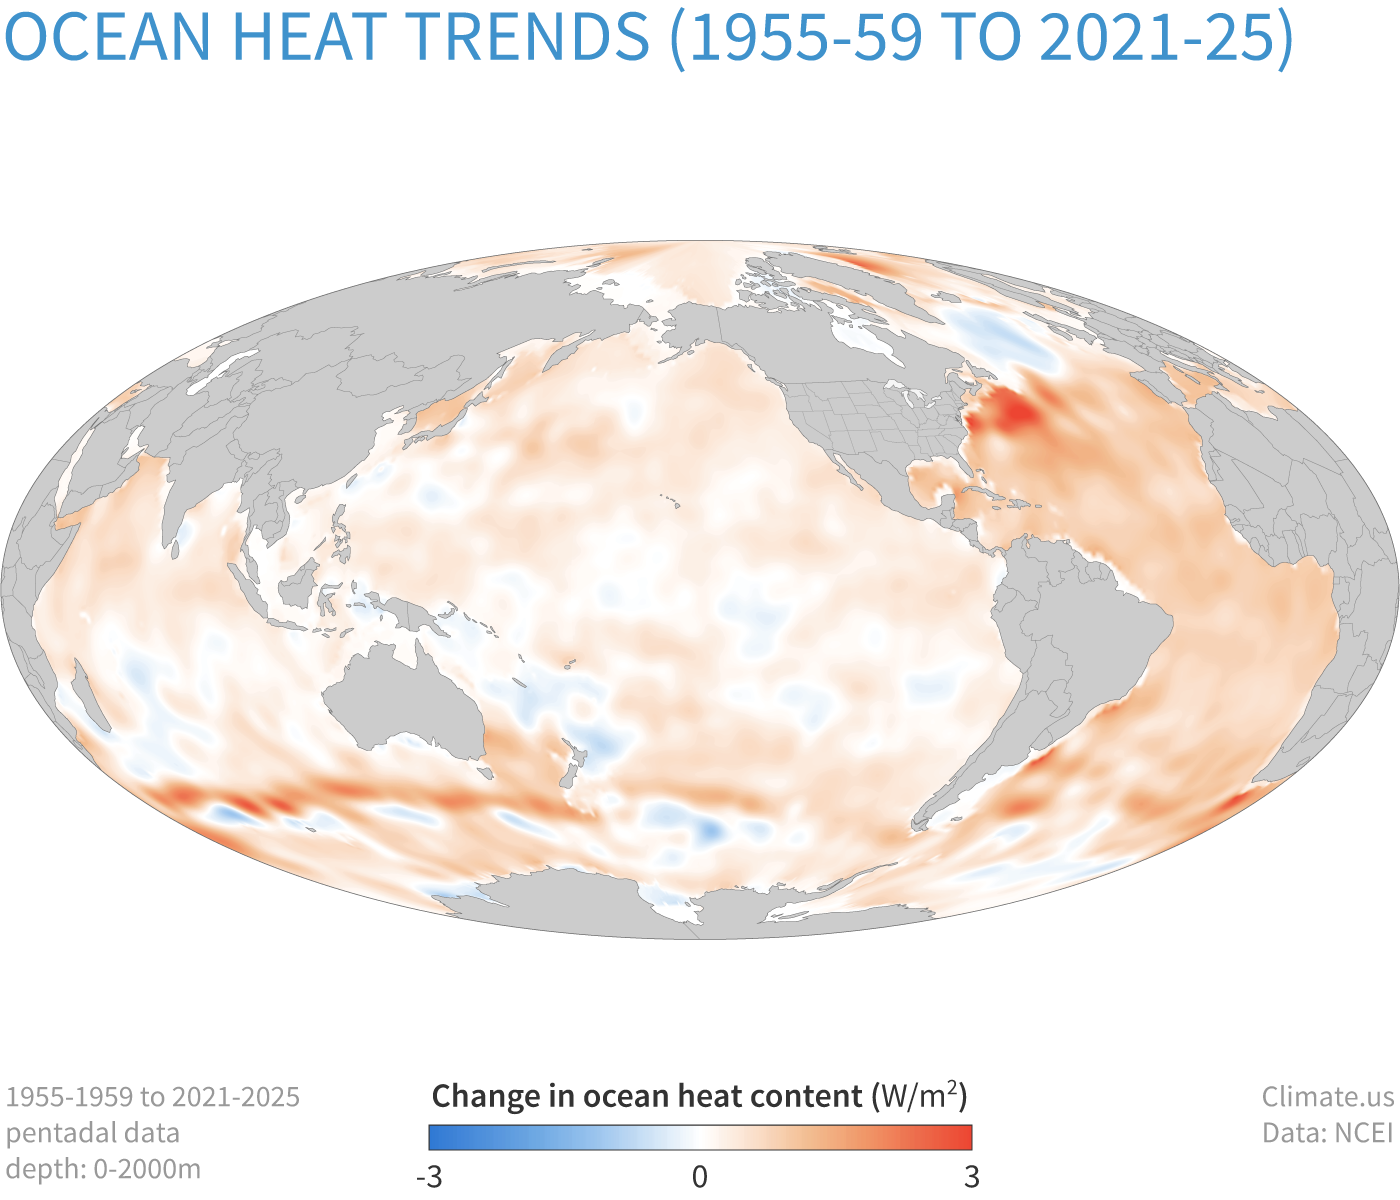
The oceans have absorbed about 90% of the excess heat trapped by greenhouse gases from 1971–2020.
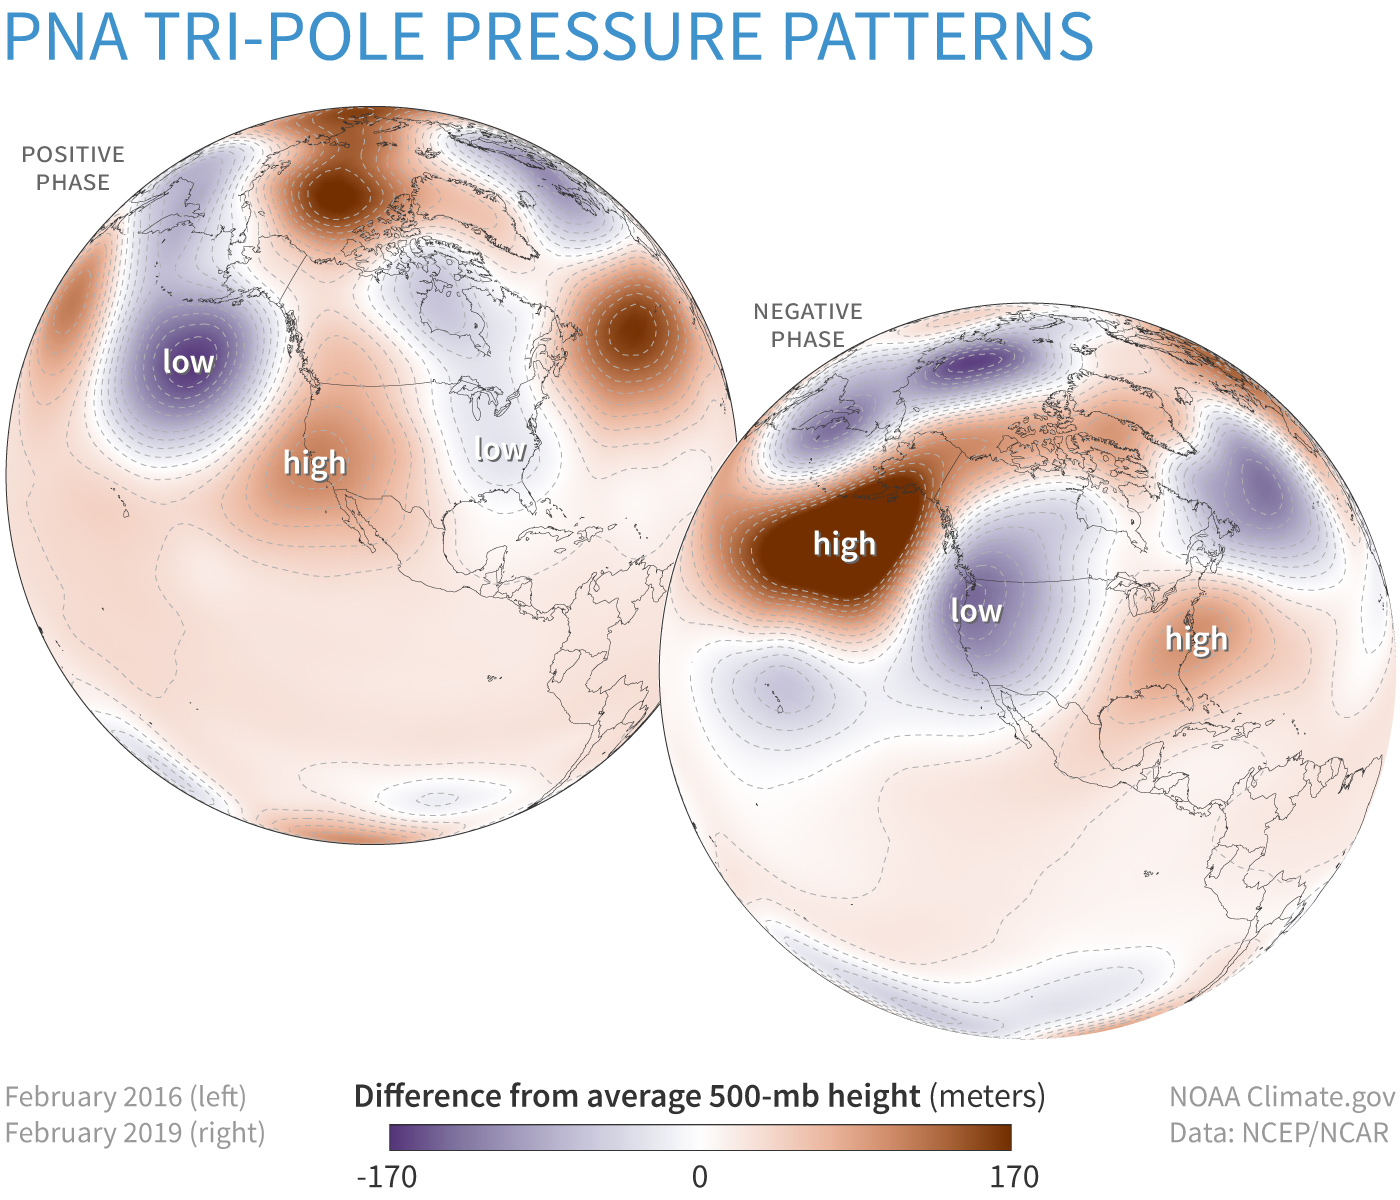
The Pacific-North America (PNA) index tracks changes in high and low pressure patterns that affect weather across North America.
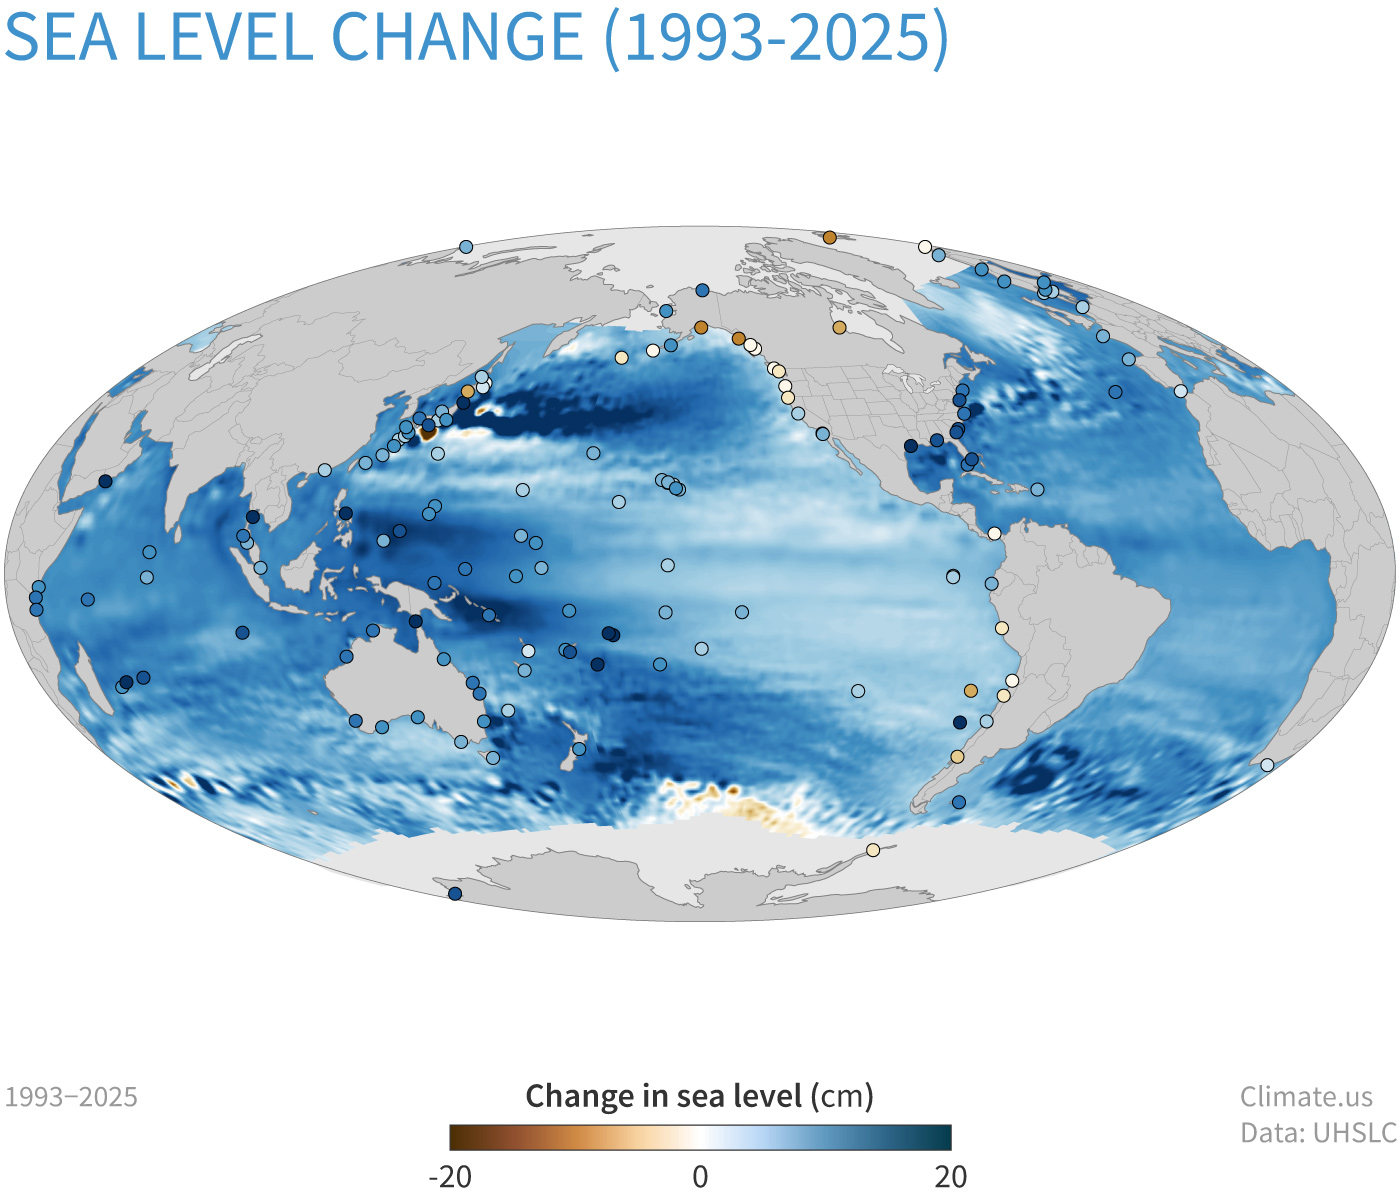
Sea level has risen 8-9 inches since 1880, and the rate of increase has accelerated over the satellite era.
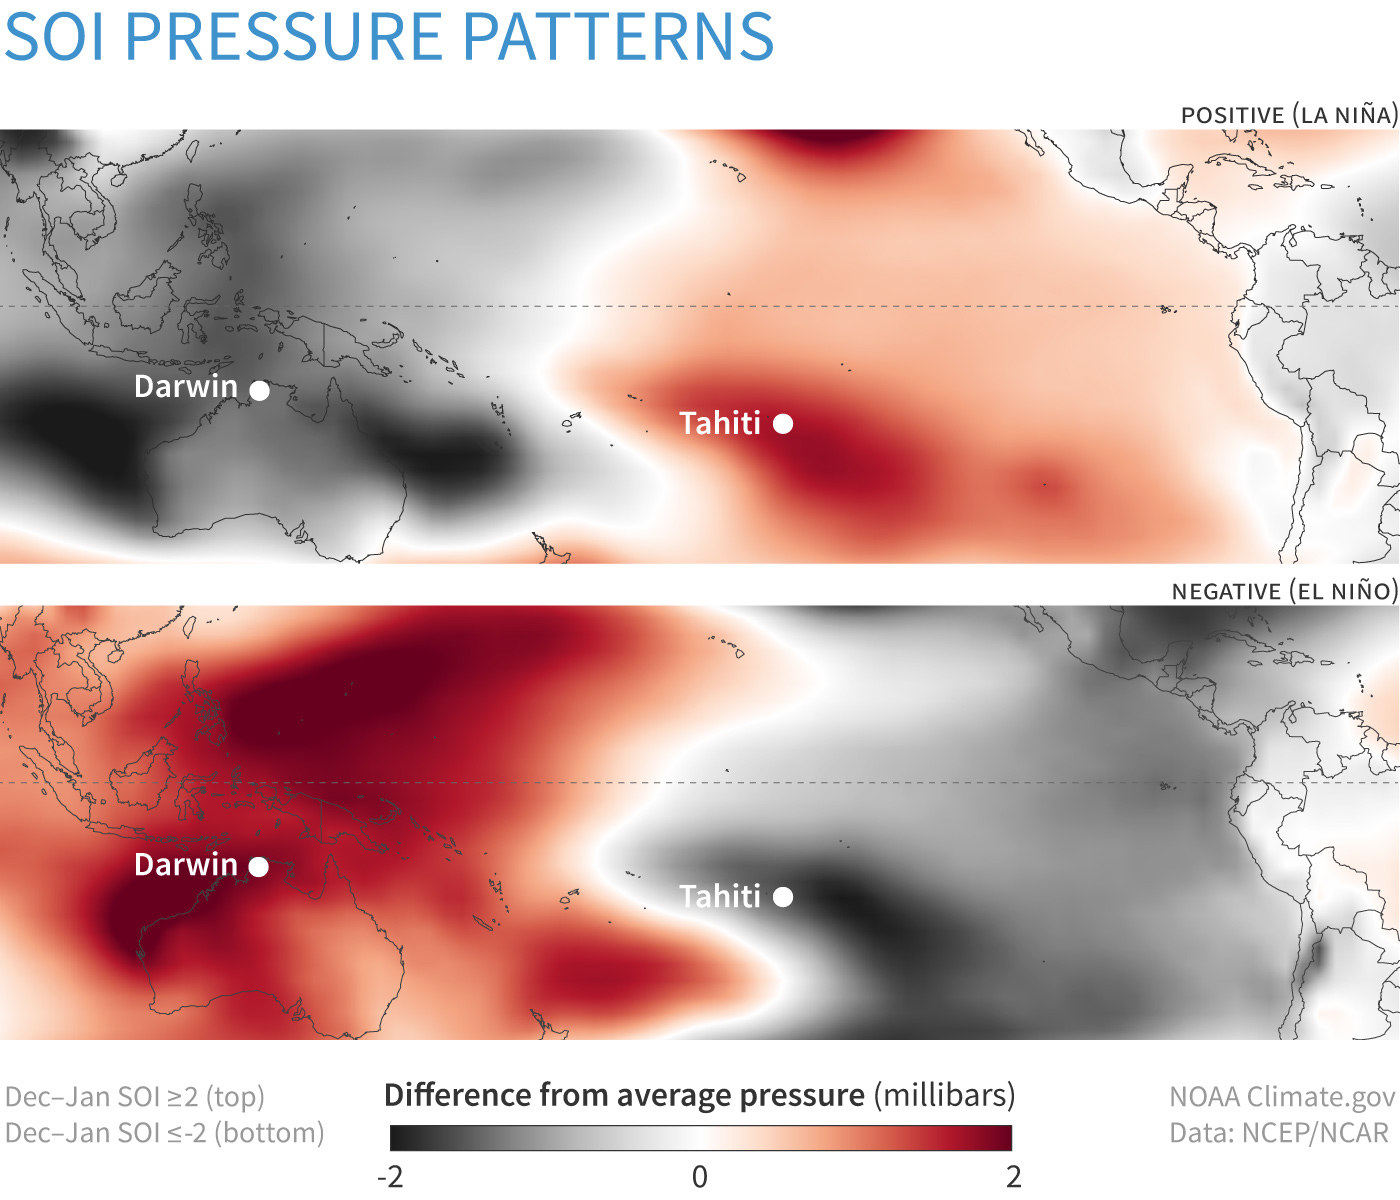
The Southern Oscillation Index (SOI) tracks changes in pressure and wind across the tropical Pacific during El Niño and La Niña.
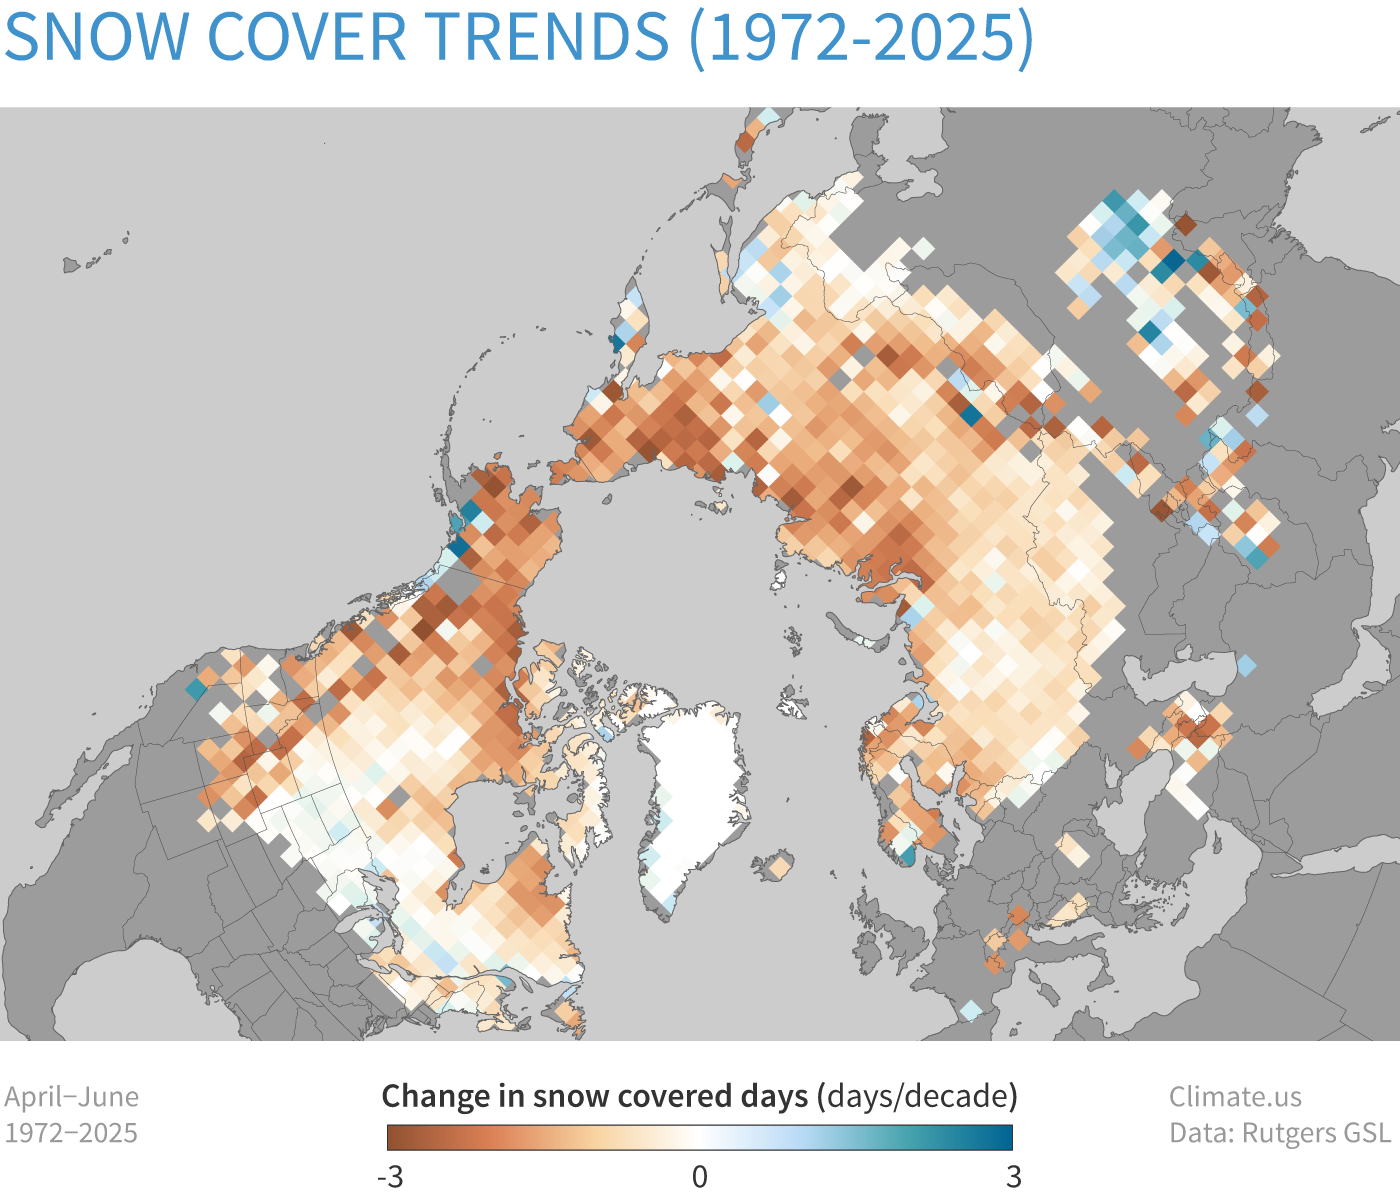
Northern Hemisphere June snow cover has shrunk by 14.6 percent per decade.
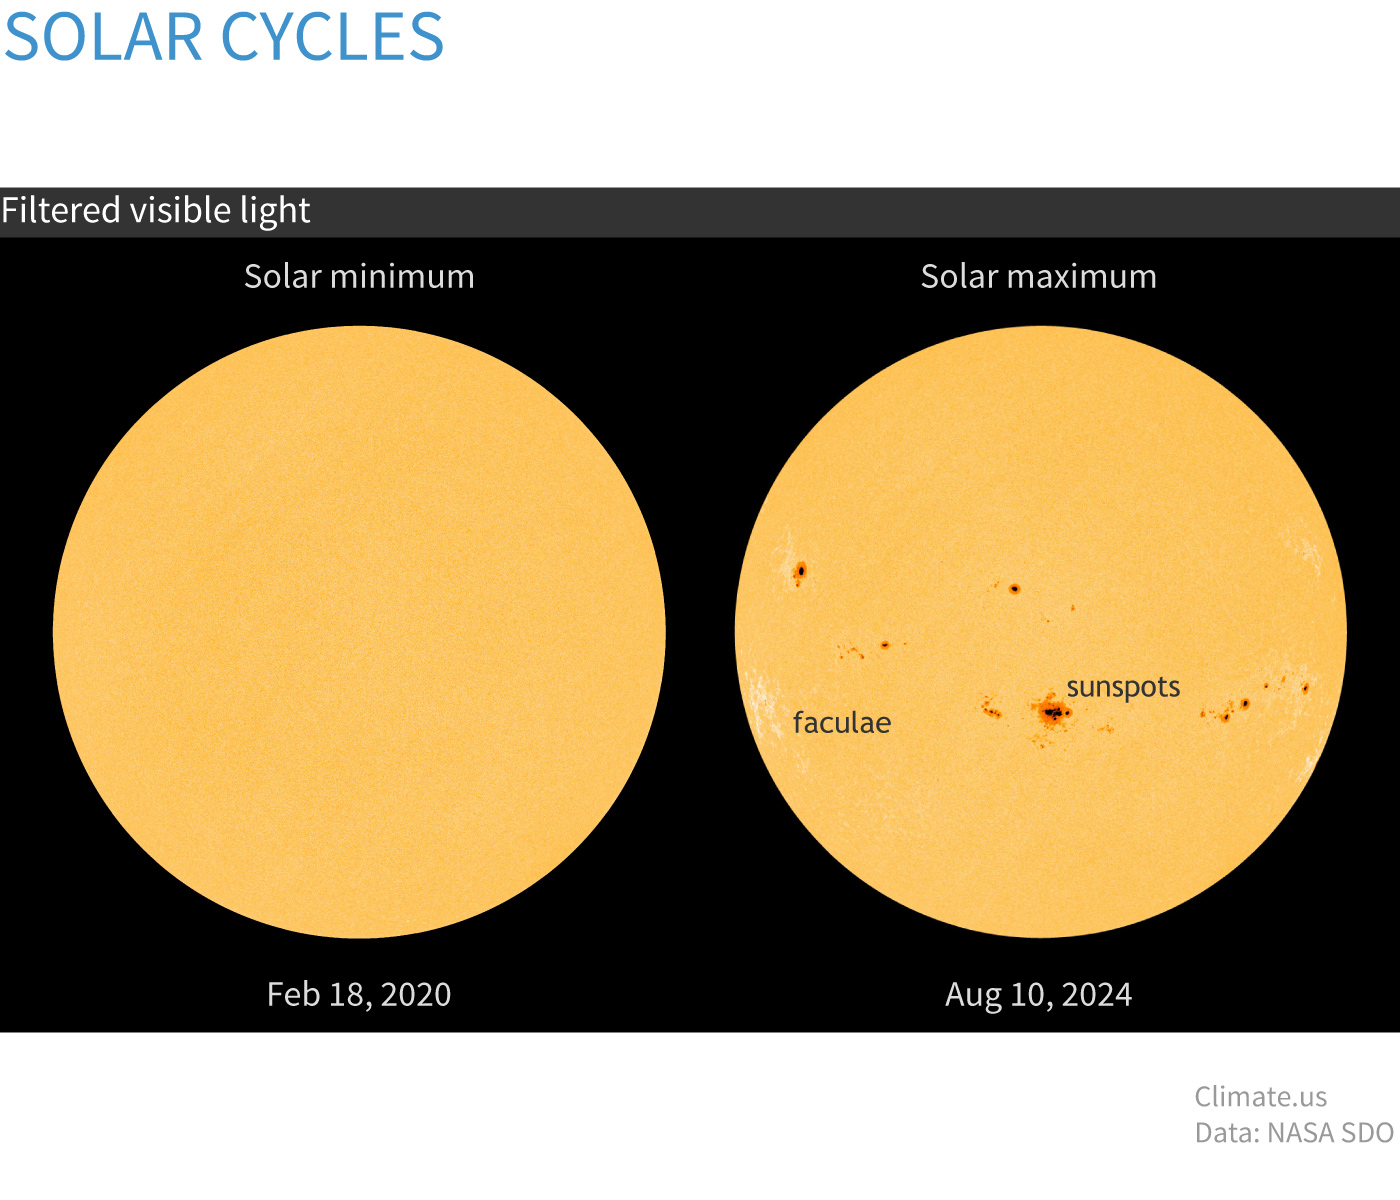
The sun’s activity during the most recent complete cycle was among the lowest in a century.
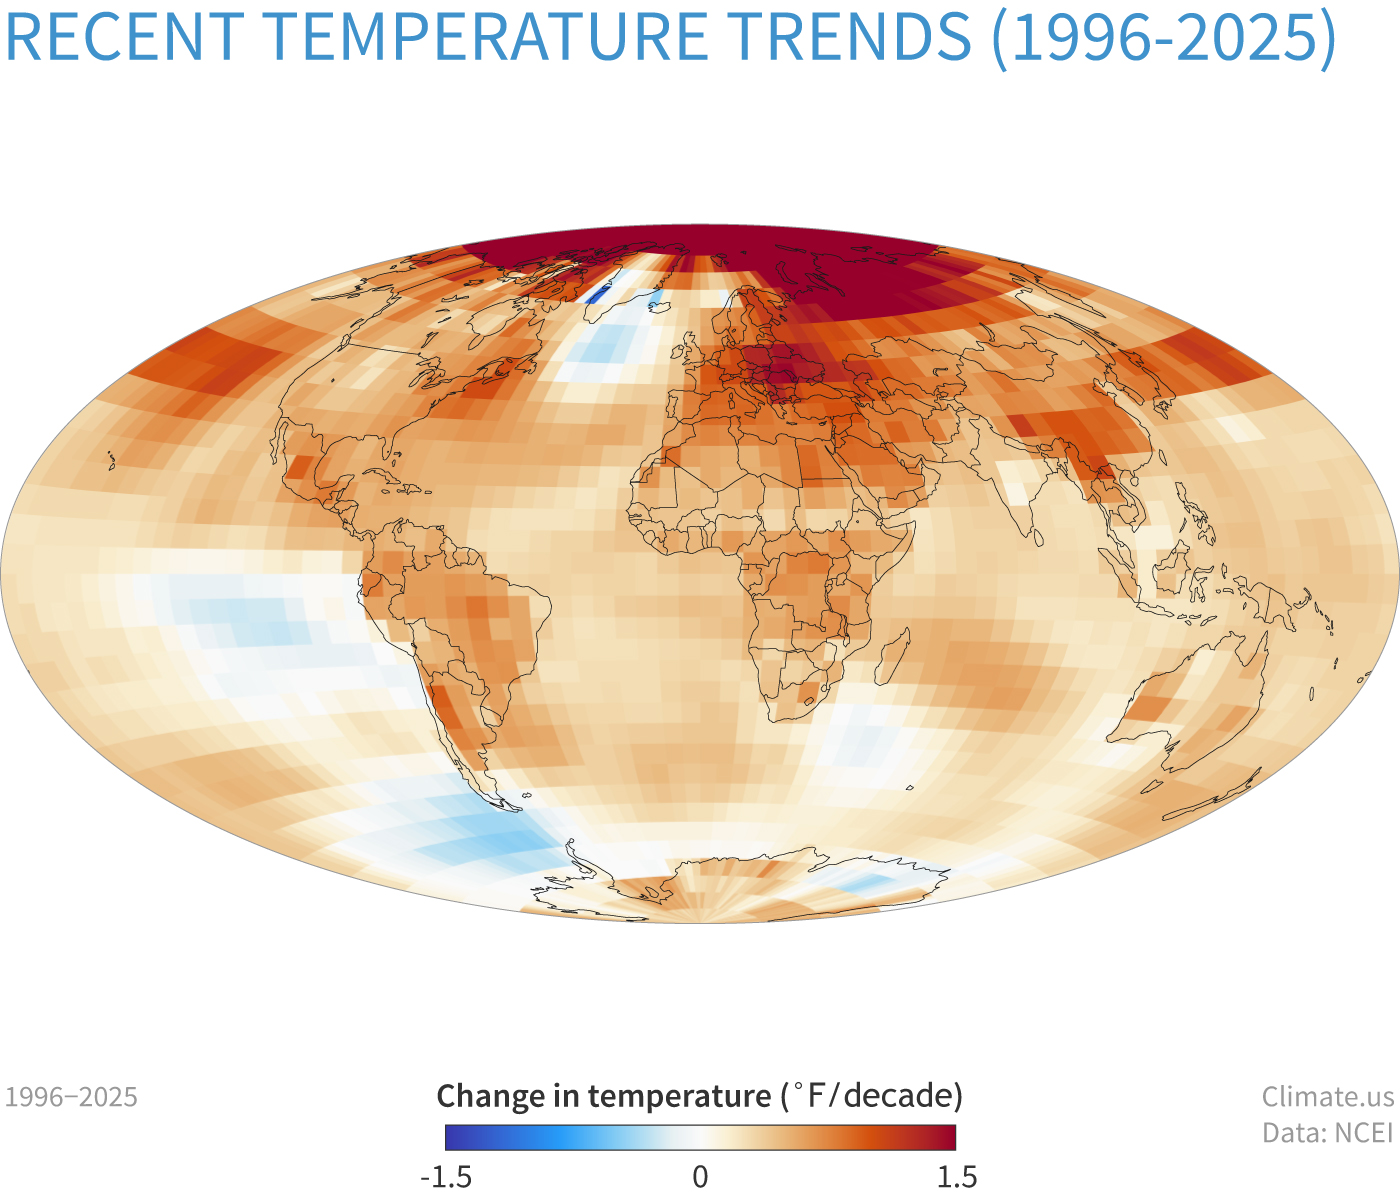
Earth's temperature has risen about 2 °F (1.1 ˚C) since the start of the NOAA record in 1850.