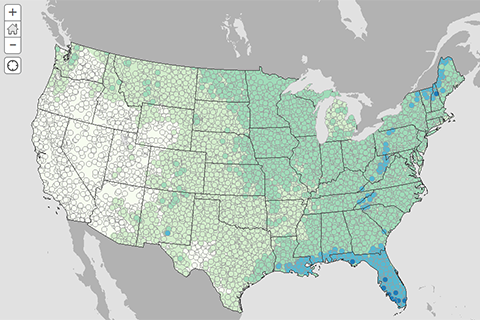
If you had to pick your Fourth of July picnic location based solely on past weather, where does the climate record say you'll have the least chance of rain? Our interactive map shows historic odds of rain on your parade.
If you had to pick your Fourth of July picnic location based solely on past weather, where does the climate record say you'll have the least chance of rain? Our interactive map shows historic odds of rain on your parade.
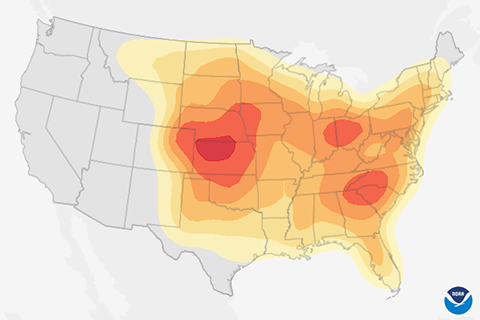
April showers bring May flowers, but what does June bring? History says mid-to-late June brings a higher probability of severe weather across much of the contiguous United States.
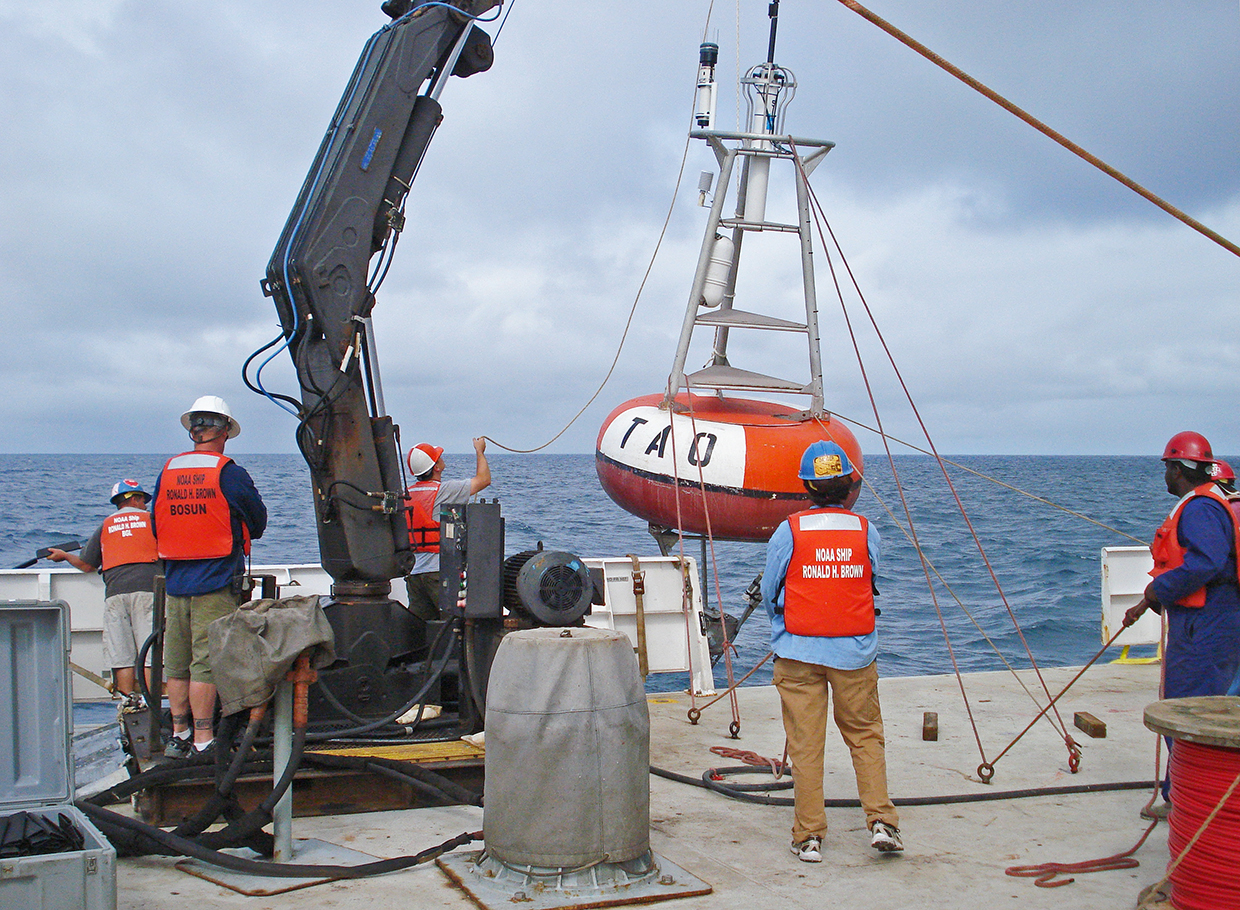
How much do ENSO blog writers like marine-based observations? Enough for one of them to write a love letter to a buoy.
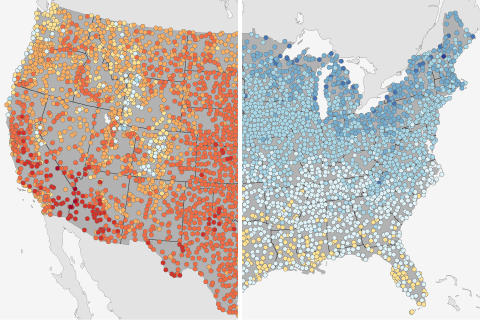
How do this year's temperatures on the first day of summer compare to historical highs and lows? Compare your local conditions to these maps showing the warmest and coldest first days of summer for more than 4,000 U.S. locations.
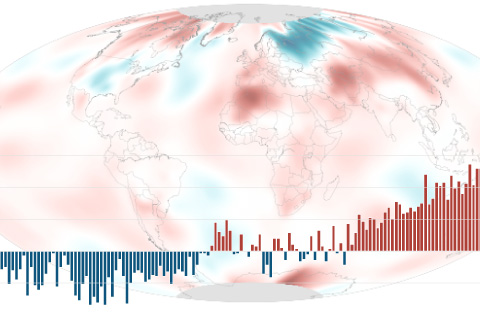
The May temperature across global land and ocean surfaces was 1.49°F above the twentieth-century average of 58.6°F. Since 1880, May temperatures have been rising by 0.13°F (0.07°C) per decade.
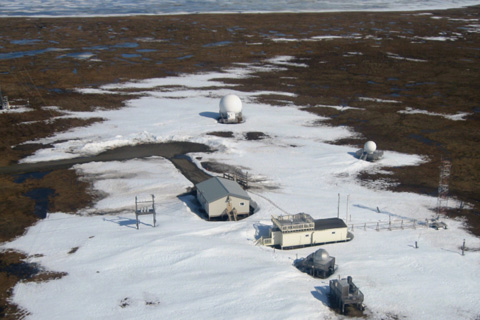
Thanks to warming winters and thawing permafrost, Arctic soil microbes are churning out carbon dioxide well after the end of the growing season ends. This extra source of atmospheric carbon may accelerate a regional warming trend that is already twice as fast as the global average.
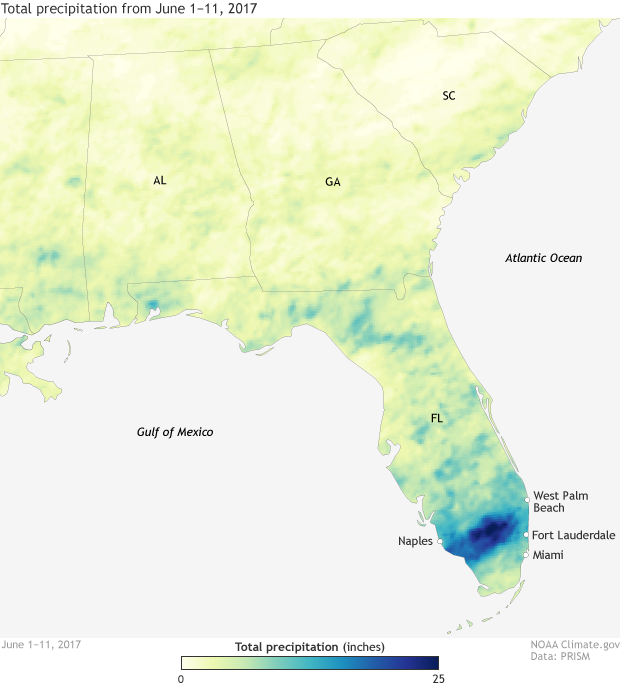
Heavy rain in the first part of June has put a significant dent in the recent drought conditions in Florida.
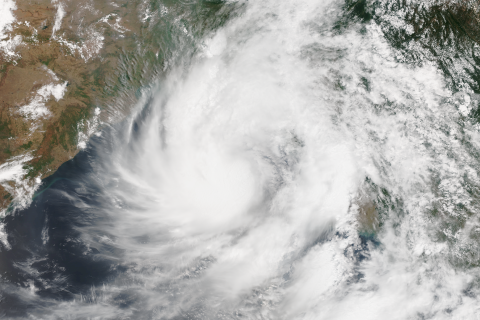
In late May, cyclone Mora made landfall across Bangladesh, a country vulnerable to cyclones and sea level rise.

Our blogger discusses the ENSO forecast, with a side of climate change.

At the end of May 2017, central Florida was the only part of the contiguous United States experiencing extreme drought. These maps come from a new drought surveillance system that can detect vegetation stress without knowing anything about how much it has rained.