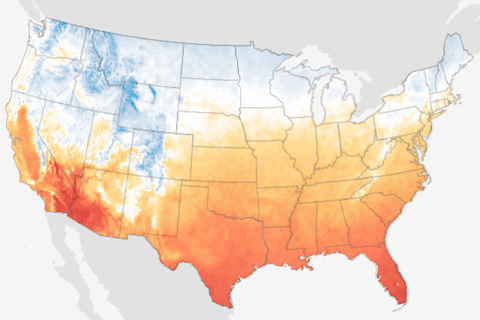
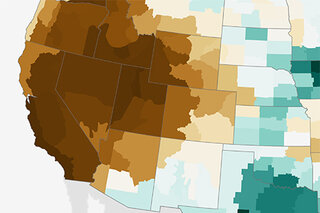
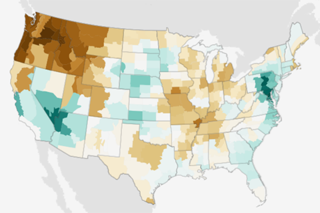
This animated gif shows how October average temperatures in the contiguous United States are projected to change in coming decades if global carbon dioxide emissions continue along a high-emissions pathway.
This animated gif shows how October average temperatures in the contiguous United States are projected to change in coming decades if global carbon dioxide emissions continue along a high-emissions pathway.
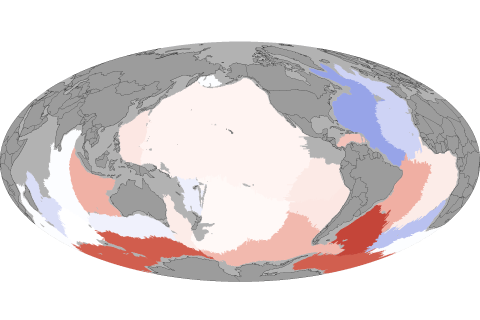
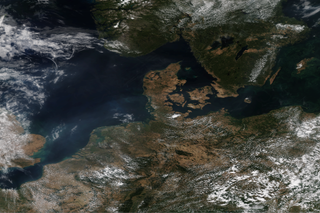
Earth's coldest waters are warming, an indication that global warming has reached one of the most remote corners of the ocean's circulatory system.

October 18, 2018
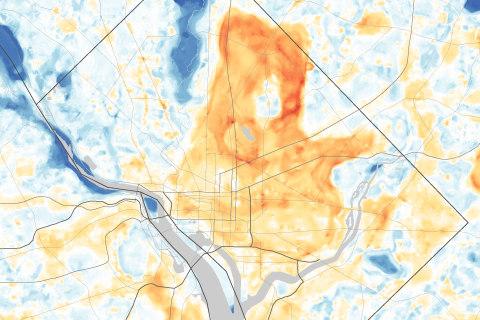
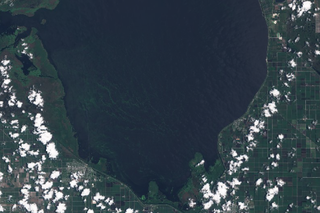
Use a slider to compare satellite images of Washington, DC, and Baltimore, MD, with maps of afternoon temperatures to see the hottest and coolest parts of the city on a late summer day.
October 15, 2018
October 9, 2018
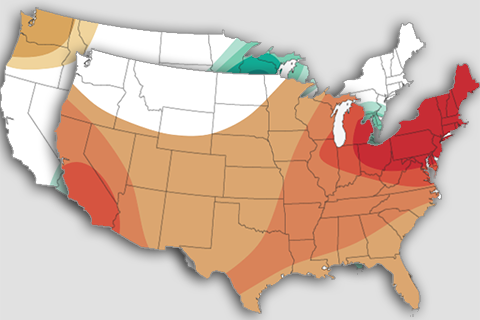
The September 2018 temperature and precipitation Outlooks for the United States predict warmer than average temperatures for much of the country and wetter than average conditions for the central Plains and eastern seaboard.
August 30, 2018
August 23, 2018