U.S. climate maps: January-July 2026
Details
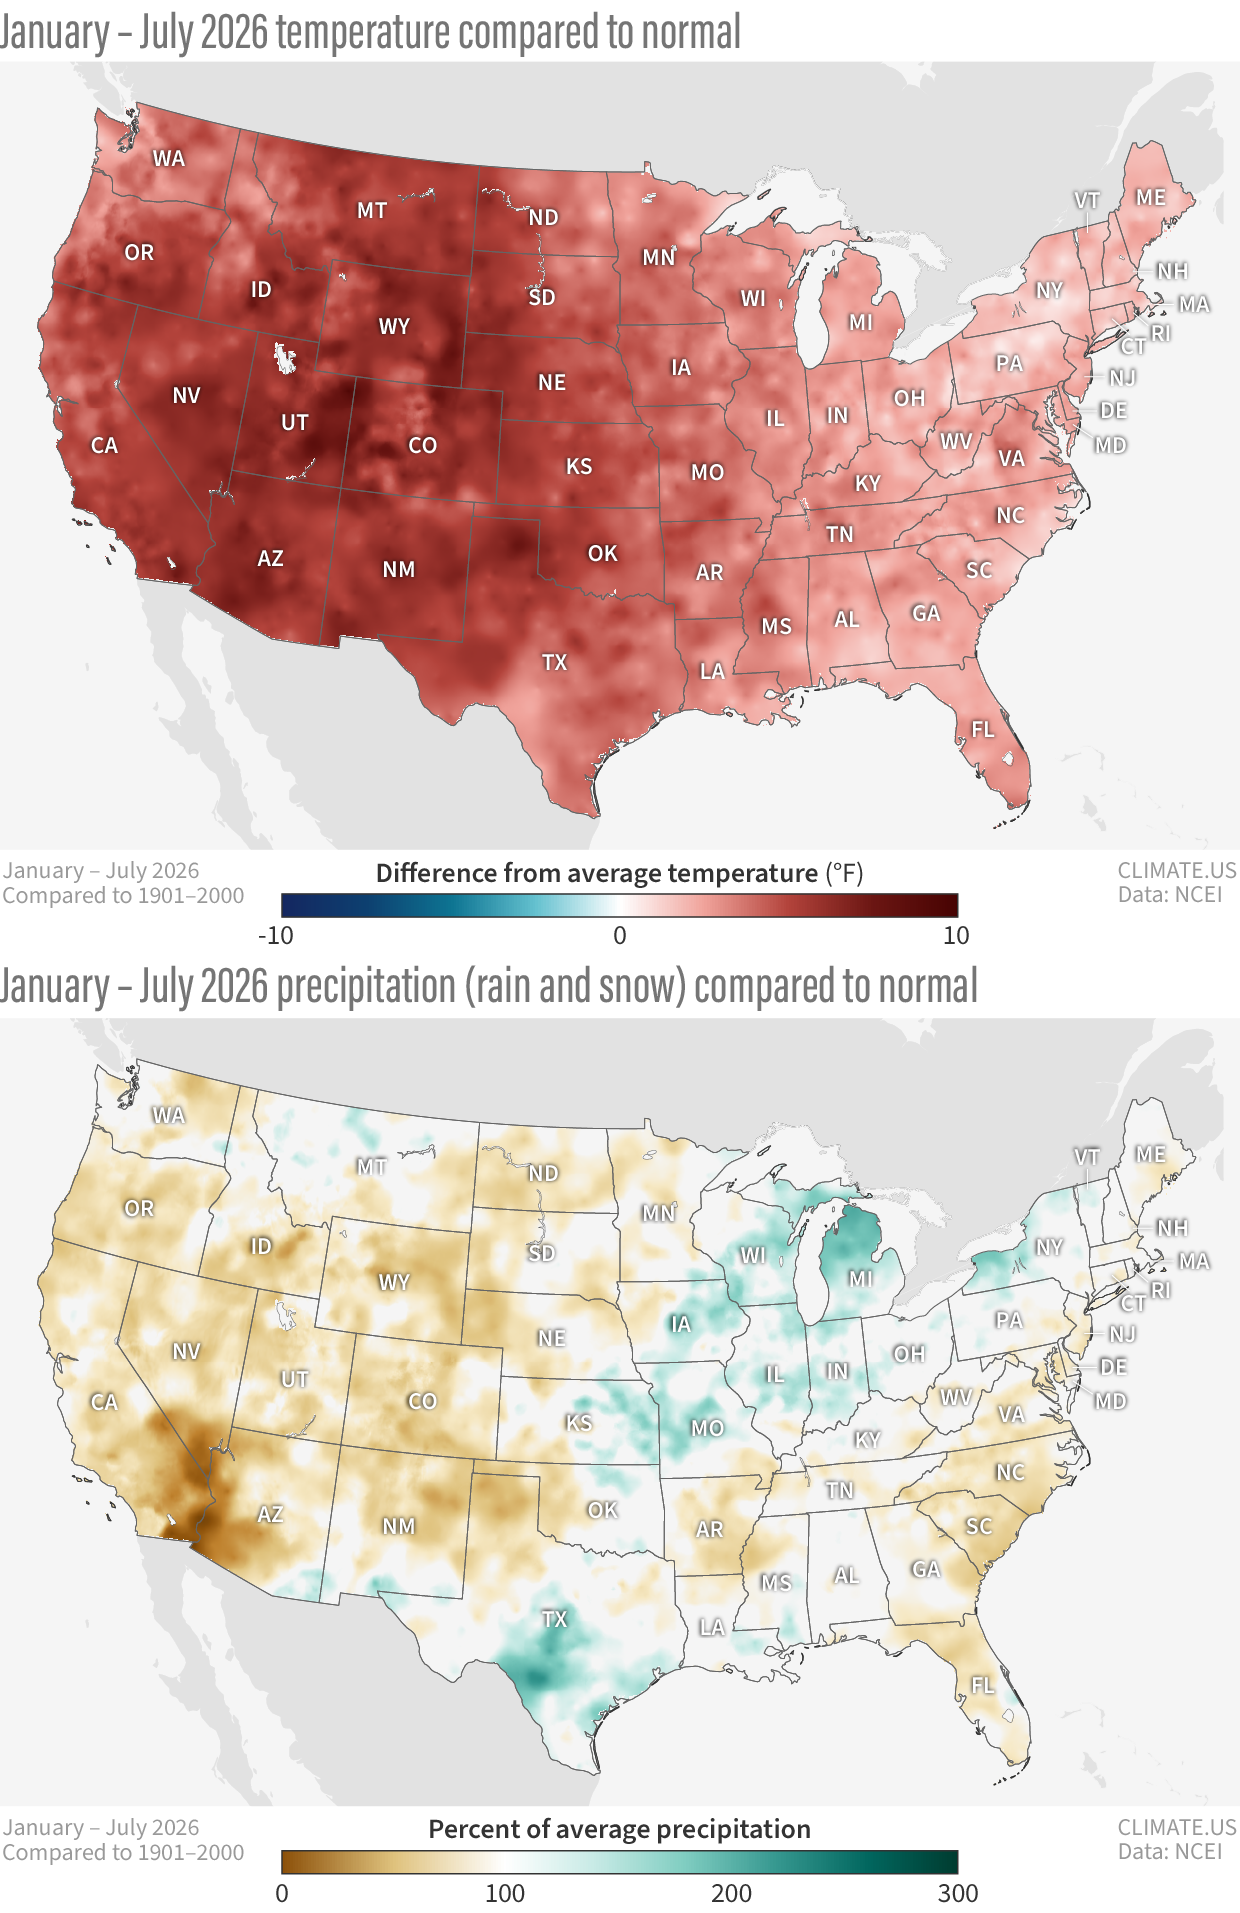
Last week, NOAA released its monthly climate report for the U.S. for July 2026 and the year to date (January–July). These maps show the year-to-date temperatures compared to the 1901-2000 average (top) and percent of normal precipitation (bottom). The maps are dominated by heat and dryness.
Temperature highlights directly from the report
The average temperature for the CONUS [contiguous United States] during January–July was 55.5°F, 4.2°F above the 20th-century average. The period ranked second warmest in the 132-year record, 0.17°F cooler than January–July 2012. Most of the CONUS saw above- to much-above-average temperatures, with 30 states ranking among their 10 warmest January–July periods on record. Eight states recorded their warmest January–July period on record.
Based on the NOAA climate regions, the West and Southwest each experienced their warmest January–July period on record, while the South ranked second warmest, the Northern Rockies and Plains third warmest and the Northwest region fourth warmest. The Southwest region was especially anomalous, averaging 6.0°F above its 20th-century January–July baseline and eclipsing the previous record, tied in 2000 and 2018, by 2.1°F.
At the county level, more than 450 counties—covering over one-quarter of the CONUS and affecting an estimated 72 million people—recorded their warmest January–July on record, reflecting the broad geographic footprint of the period's record warmth.
See the report for temperature maps and statistics for Alaska and Hawaii.
Precipitation highlights directly from the report
The average precipitation total across the CONUS during January–July was 16.28 inches, 1.80 inches below the 20th-century average, ranking in the driest third of the 132-year record and the driest January–July since 2012.
Much of the western half of the CONUS received below- to much-below-average precipitation during January–July, along with parts of the Lower Mississippi and Tennessee valleys, Southeast, Mid-Atlantic and coastal areas of the Northeast. In contrast, portions of the Midwest and Great Lakes received above-average precipitation
See the report for precipitation maps and statistics for Alaska and Hawaii.