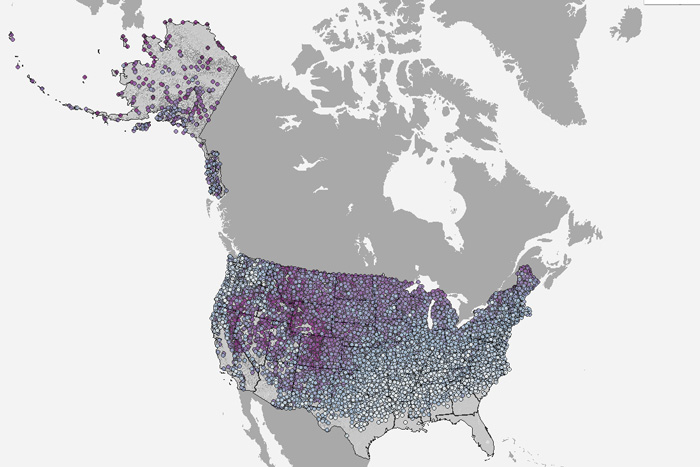
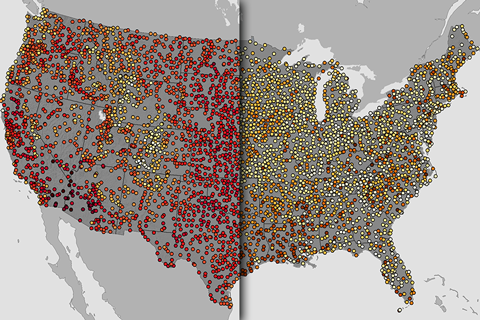
Our interactive map shows the latest date of measurable snow recorded at thousands of U.S. weather stations, based on data through April 11, 2018.
Our interactive map shows the latest date of measurable snow recorded at thousands of U.S. weather stations, based on data through April 11, 2018.
When does the chance of an overnight freeze drop below 50 percent? Explore this map to find out.
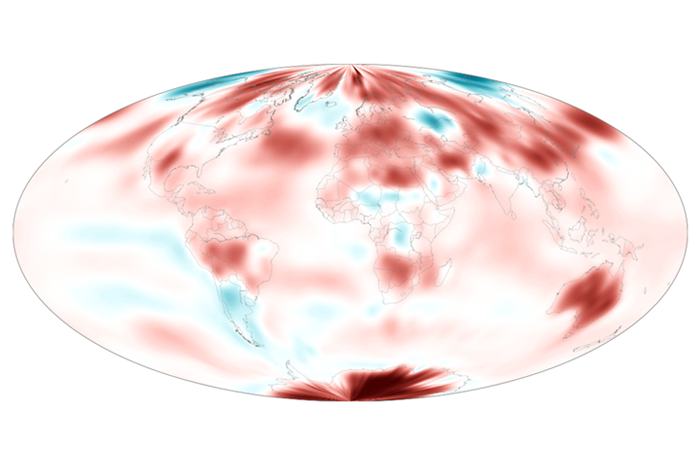
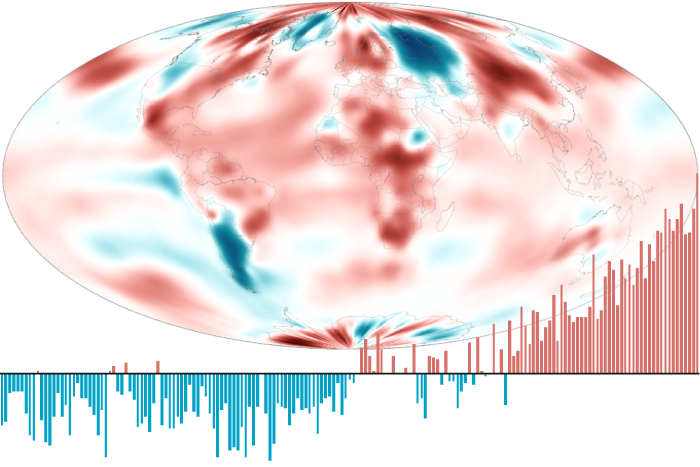
August was 15th consecutive month of record-setting global temperatures, and it brought the second-lowest August sea ice extent in the Antarctic.
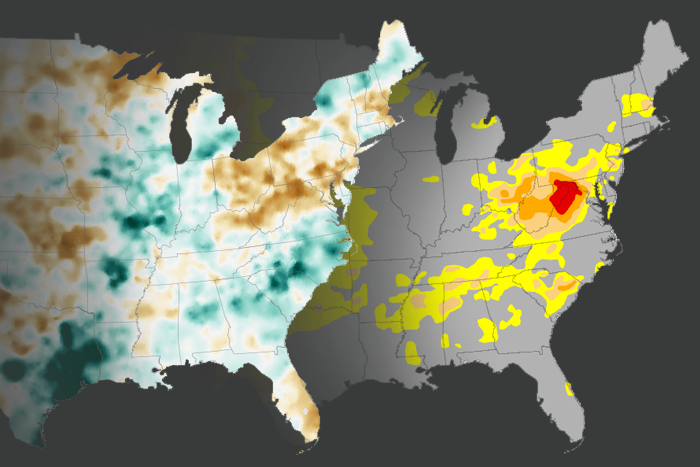
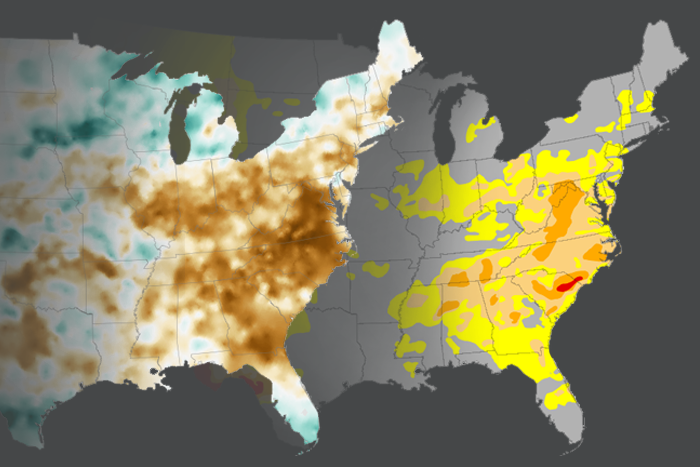
Record precipitation, tornadoes, hurricanes, and wildfires impacted the U.S.; four new billion-dollar weather and climate disasters were confirmed in July.
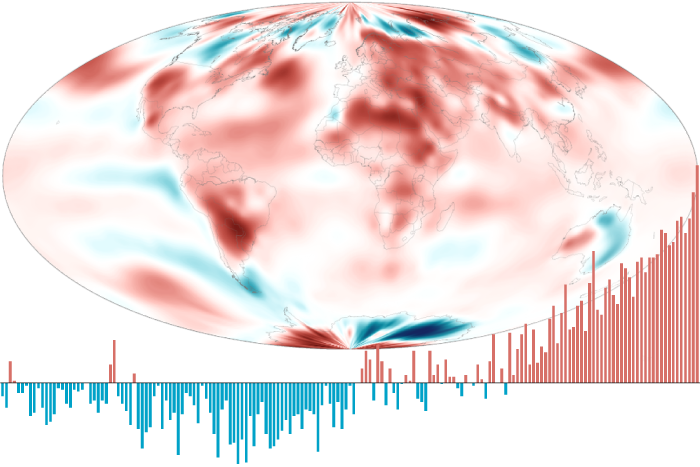
Global temperatures were record warm for the 13th consecutive month, tying for the longest record-warm global temperature streak on record.
Record-breaking heat waves impacted tens of millions of people in several parts of the country.
Global temperatures were record warm across both land and ocean in May, capping off the warmest spring on record.
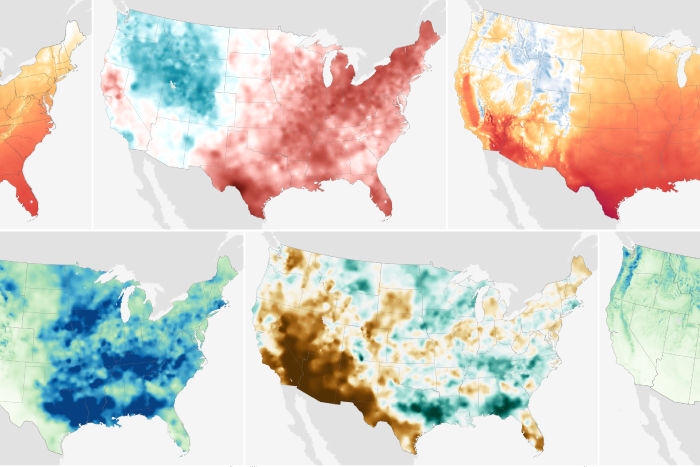
Several rounds of severe storms devastated the Midwest and Great Plains. Four new billion-dollar weather and climate disasters were confirmed in May.
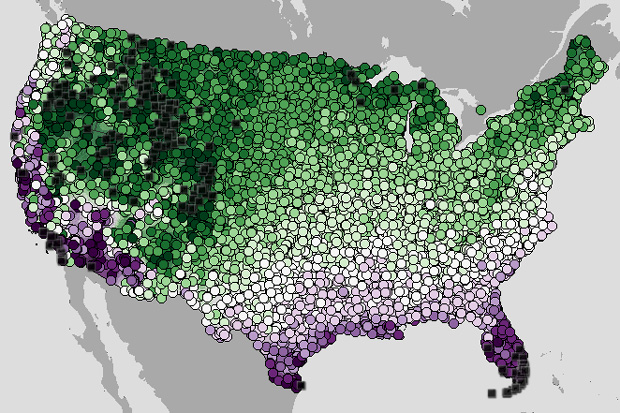
Find the hottest summer day for thousands of U.S. stations with this interactive map.
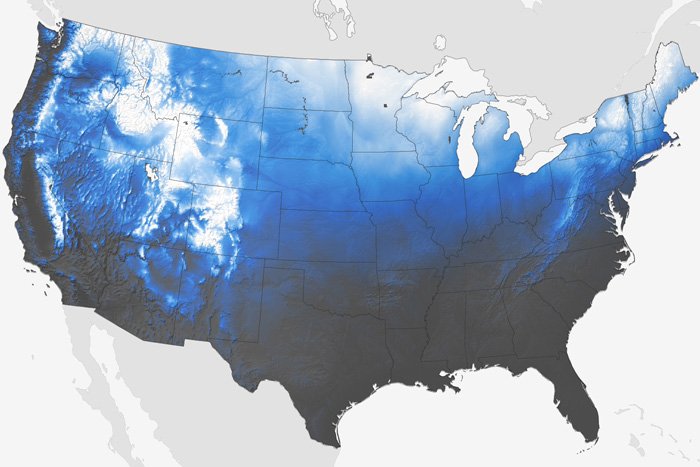
For those of you dreaming of a white Christmas, NOAA has a map showing the historic probability of your dream coming true.