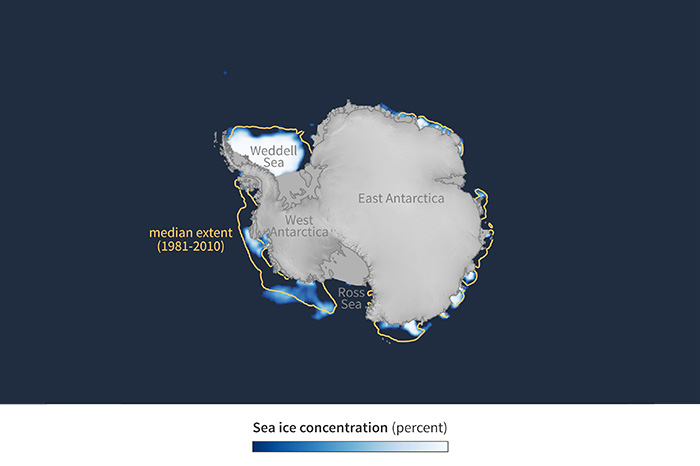
This collection includes monthly maps for sea ice concentration during the month of the Antarctic summer minimum extent—typically February—dating back to the start of the satellite record in 1979…
This collection includes monthly maps for sea ice concentration during the month of the Antarctic summer minimum extent—typically February—dating back to the start of the satellite record in 1979…
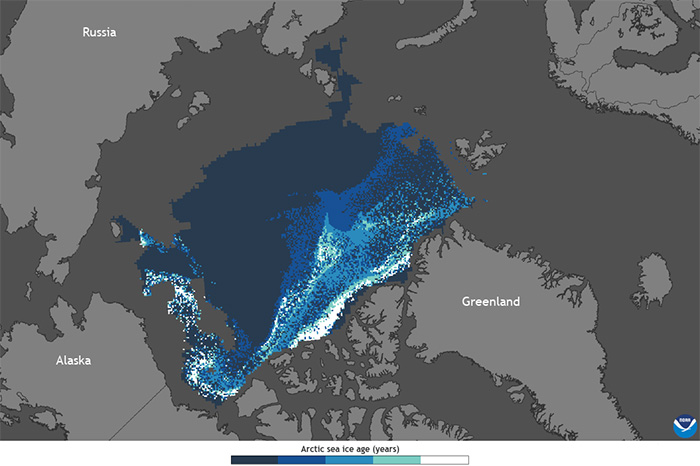
Since the late 1900s, Arctic sea ice has thinned, and less sea ice has persisted in the Arctic over multiple melt seasons. The trend toward younger, thinner sea ice over time reflects warming…
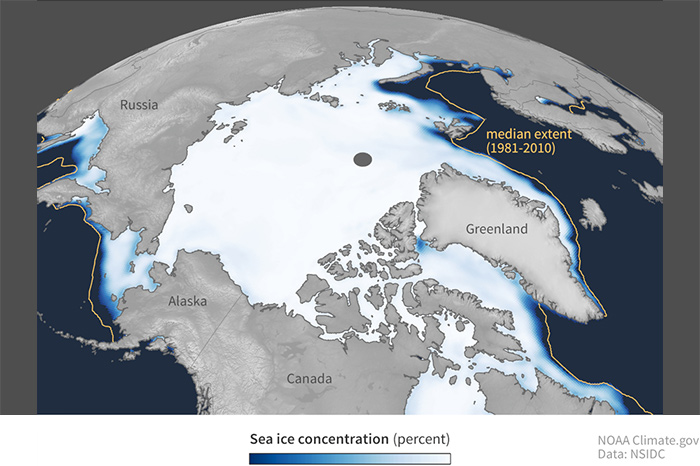
This collection includes monthly maps showing sea ice concentration during the month of the Arctic winter maximum extent—typically March, but occasionally February—dating back to the start of the…
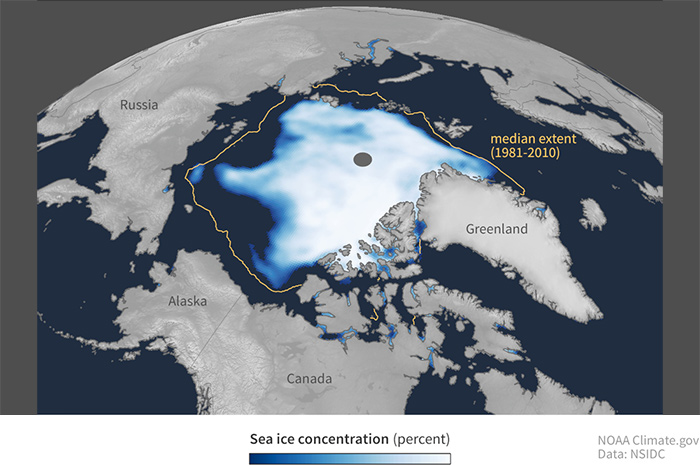
This collection includes monthly maps showing sea ice concentration during the month of the Arctic summer minimum extent, dating back to the start of the satellite record in 1979. Arctic sea ice has…
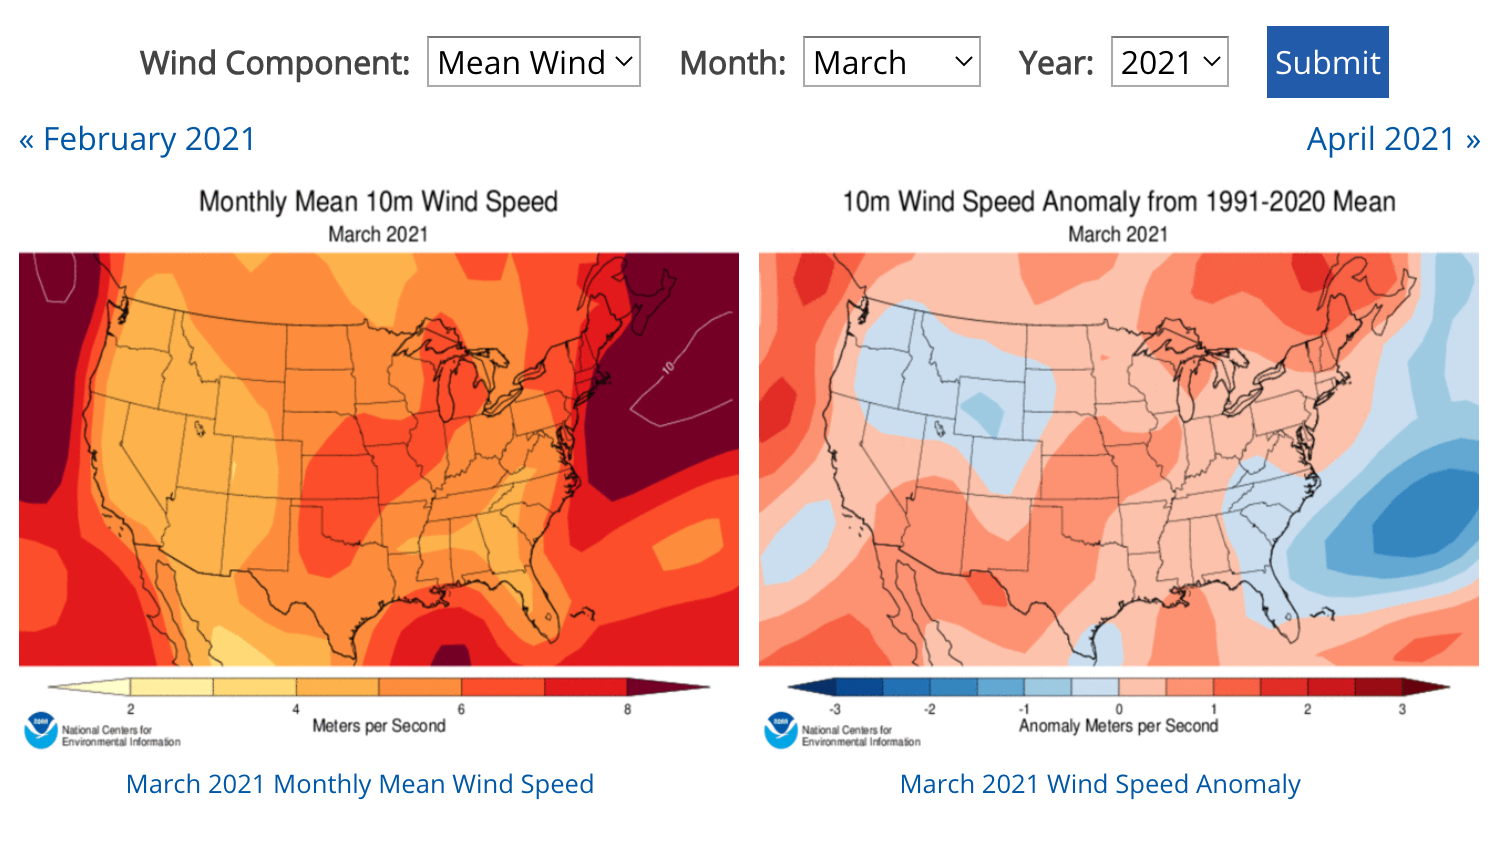
View maps of average monthly wind speed and direction for the contiguous United States from 1979 to the present.
Are you new to climate data? Ready to learn or review some of the basics?
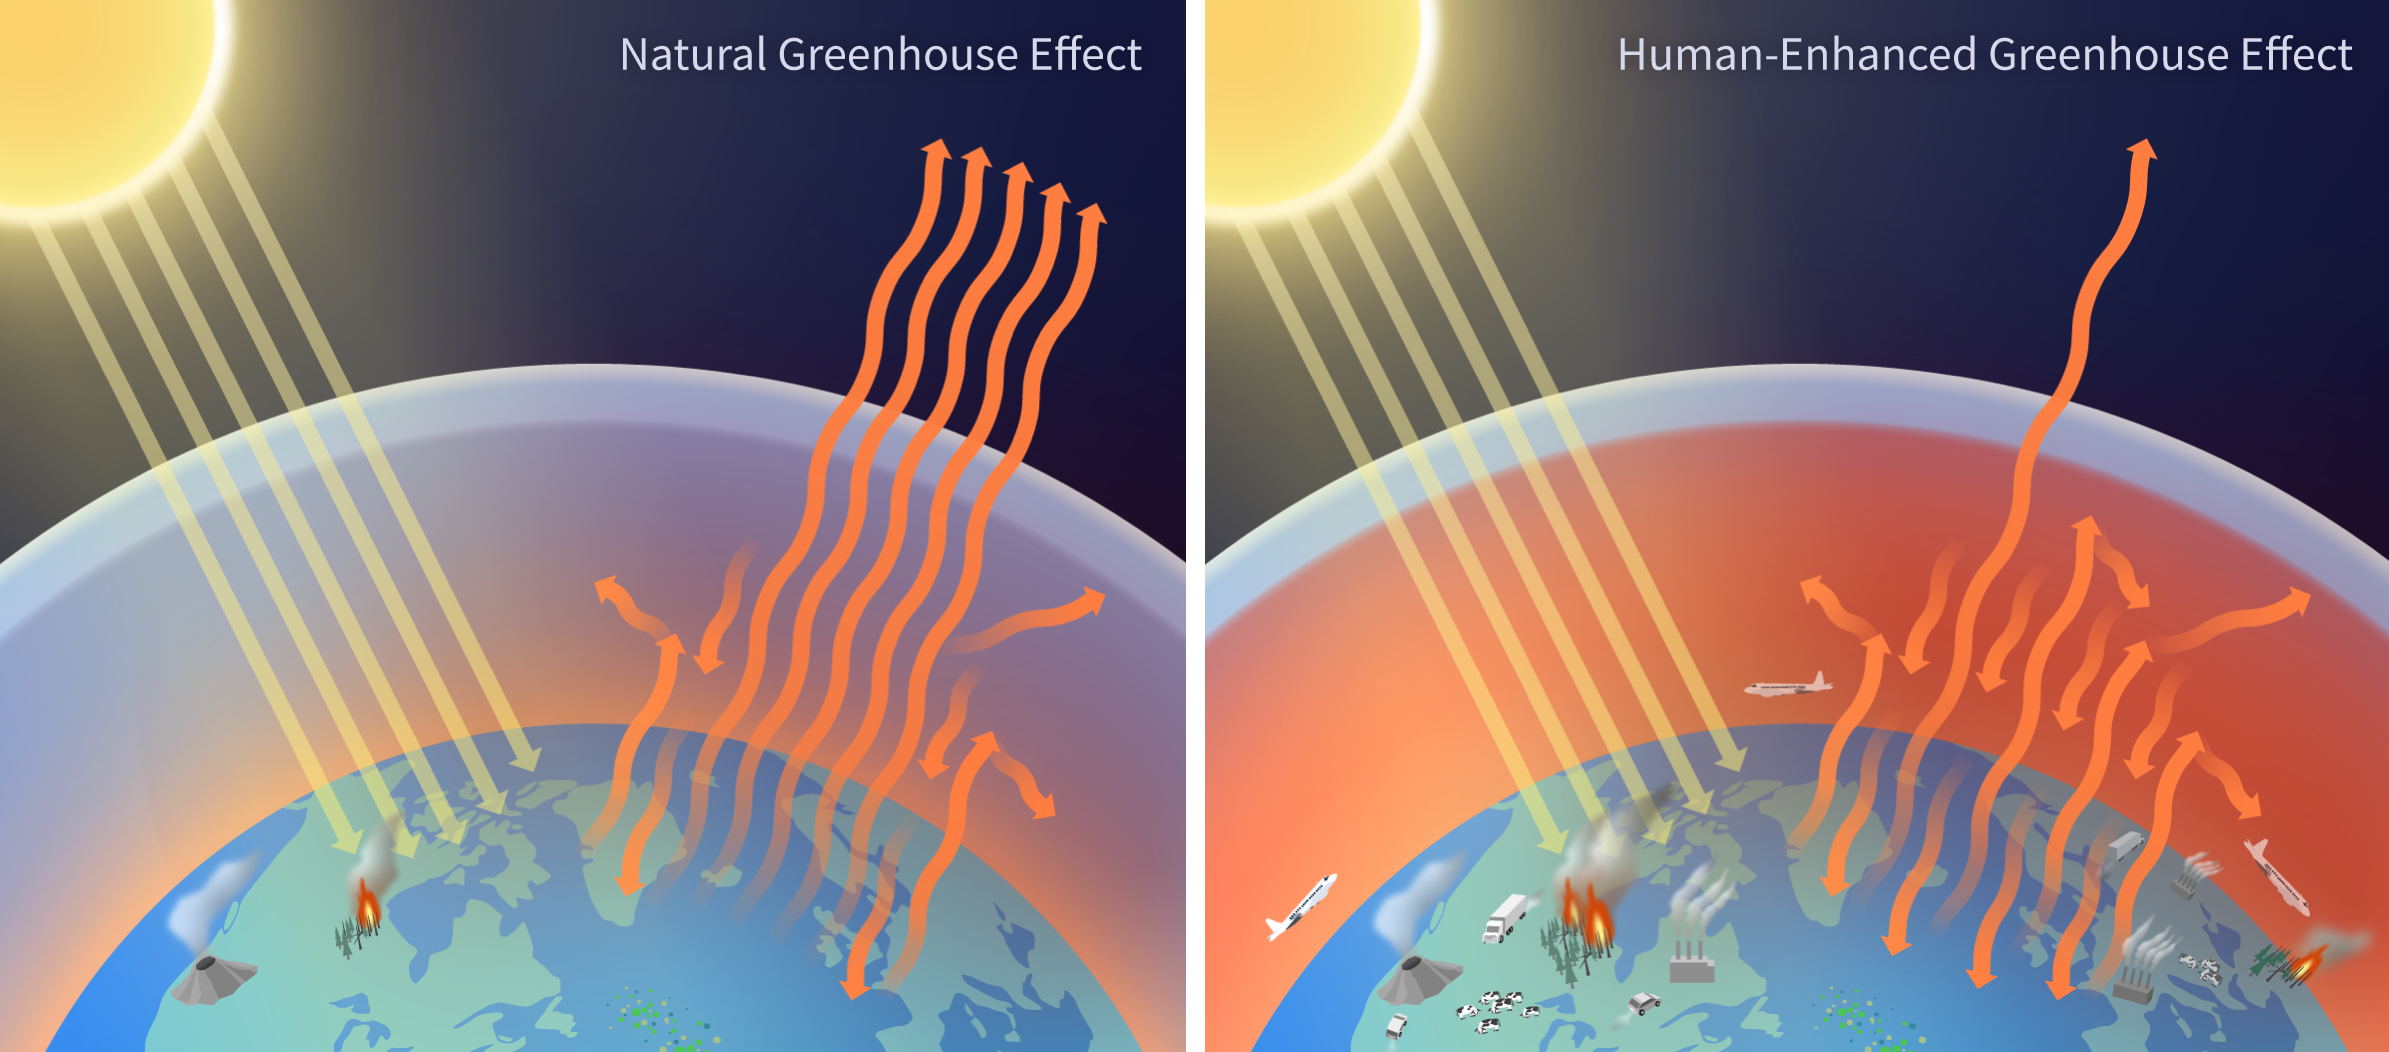
Earth is continually bathed in energy from the sun. A portion of the energy that arrives at Earth is reflected back into space, another portion is absorbed directly by the atmosphere, and the remainder moves through the atmosphere to the surface.
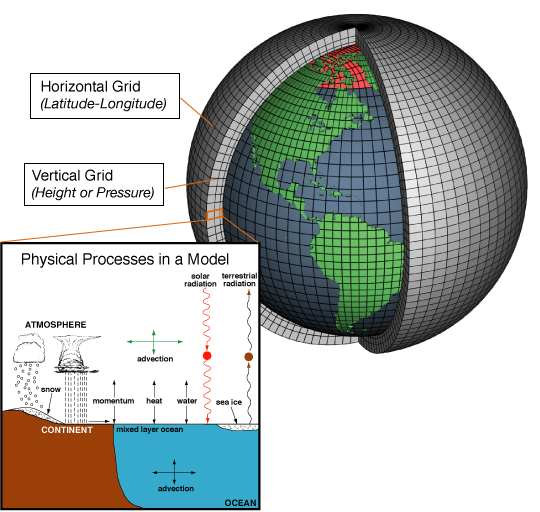
Models help us to work through complicated problems and understand complex systems. They also allow us to test theories and solutions. From models as simple as toy cars and kitchens to complex representations such as flight simulators and virtual globes, we use models throughout our lives to explore and understand how things work.
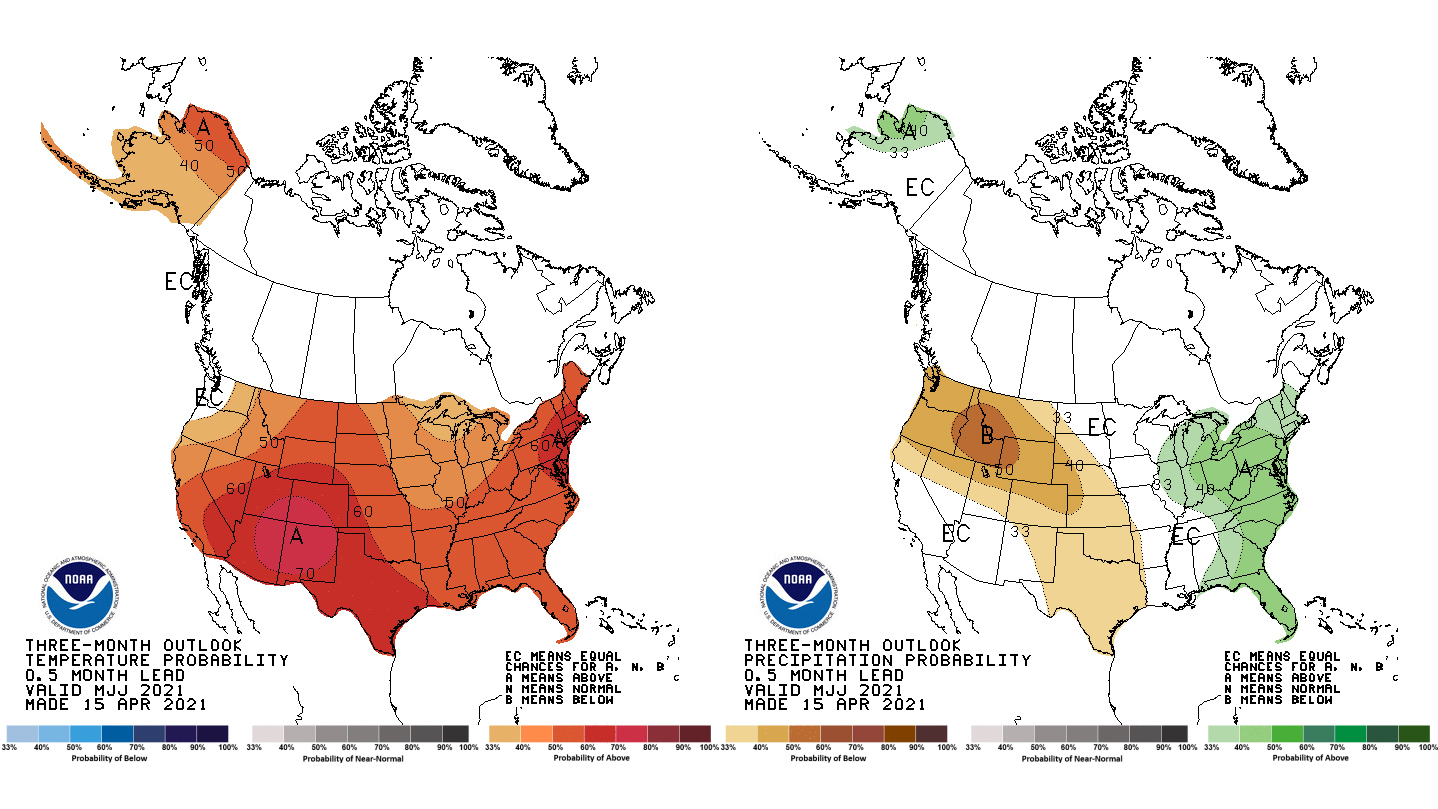
Climatologists use historical and current climate and weather data make climate predictions for temperature and precipitation in the future. These outlook products are different from weather forecasts.
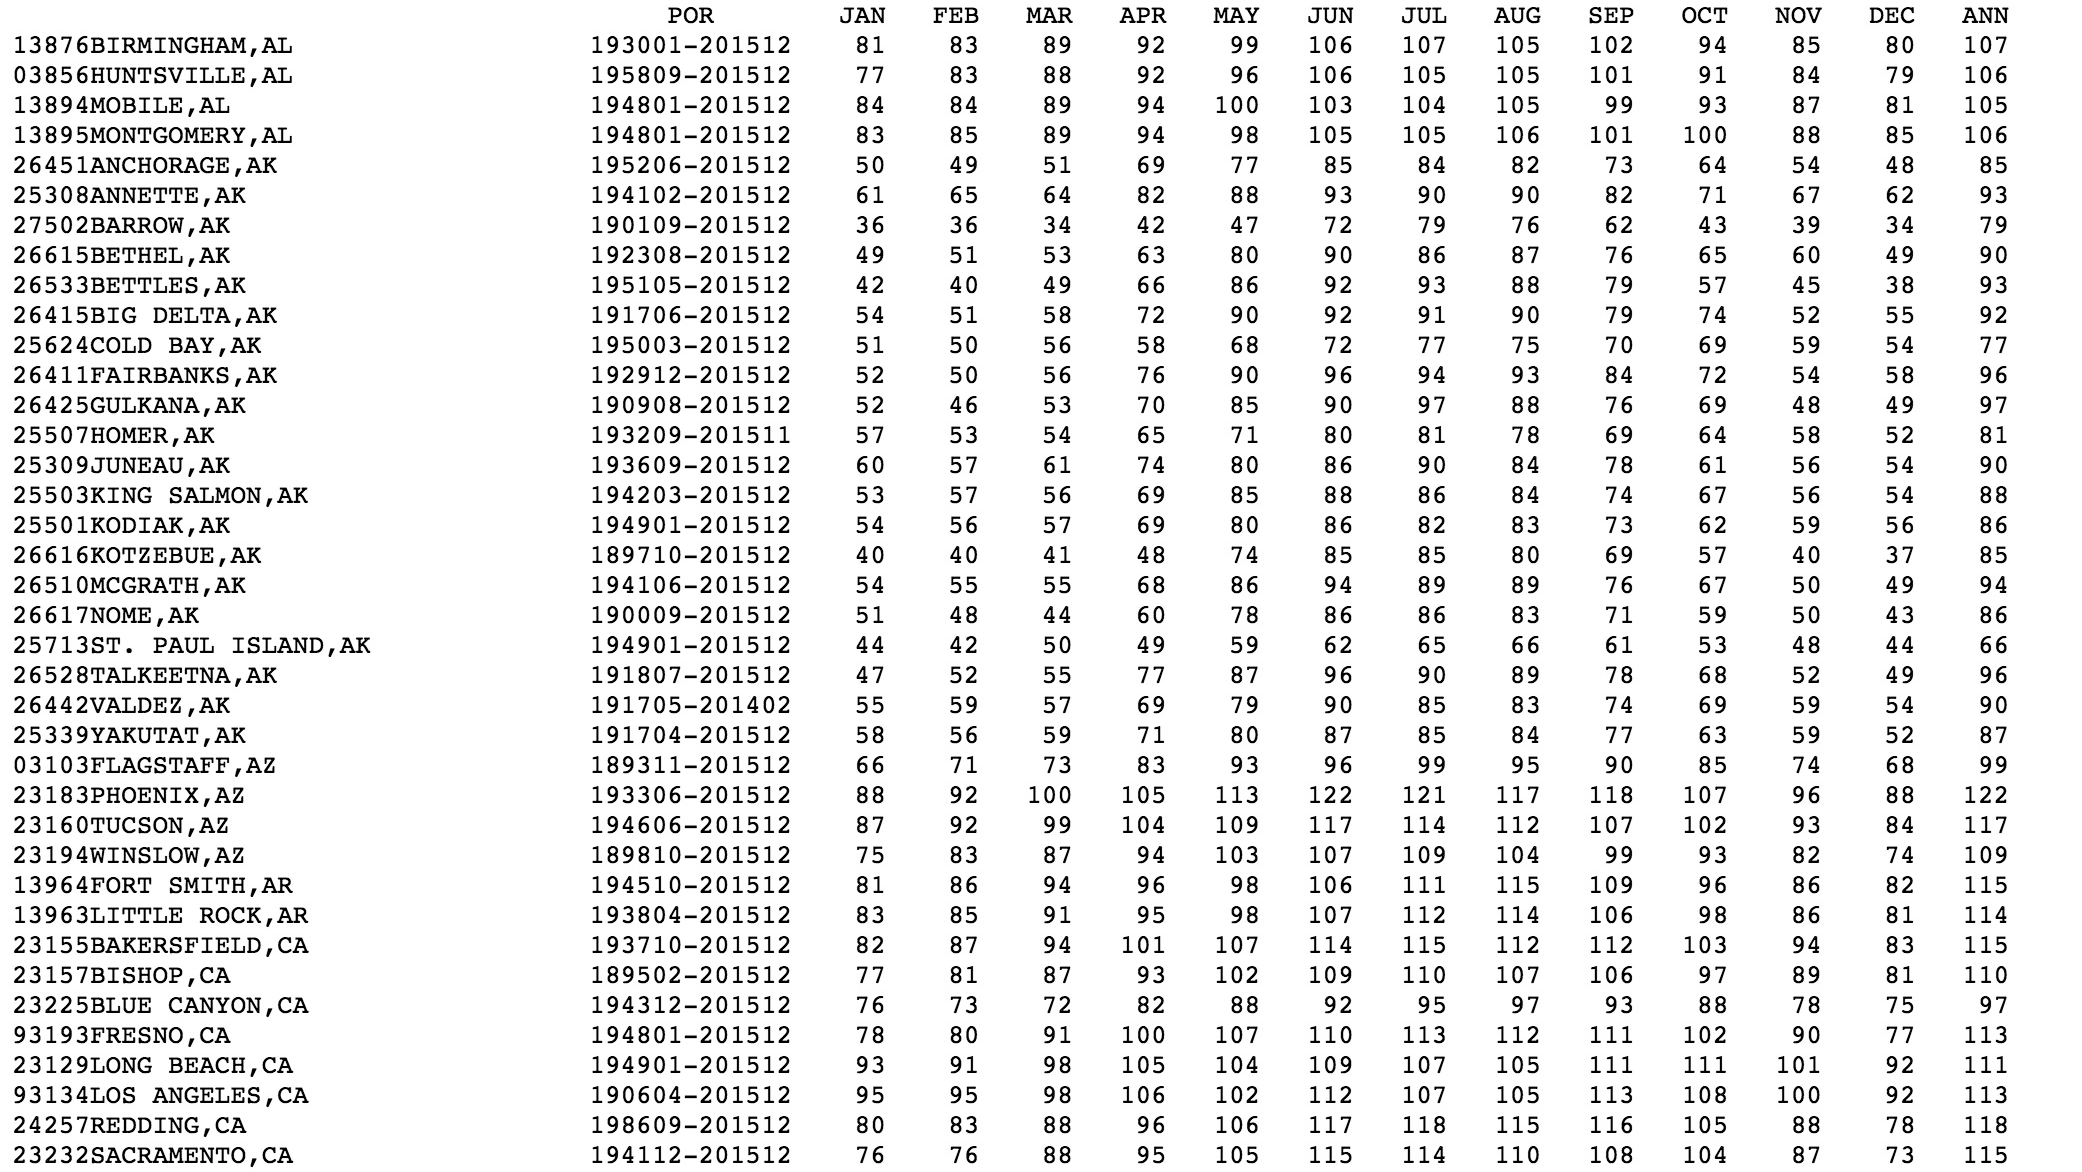
This site provides data tables for comparing record-setting conditions and Climate Normals at major U.S. weather observing stations in the United States.