Tools & Interactives

Compare March 3, 2018 to March 22, 2019 to see the extent of farmland flooding near Nebraska City, Nebraska, as rain and snowmelt swelled the Missouri River during a billion-dollar disaster event.
View this tool
When does the climate record say you can expect the season's first snow? This map shows the historic date by which there's a 50% chance of at least 0.1" of snow on the ground, based on snowfall data from 1981-2010.
View this tool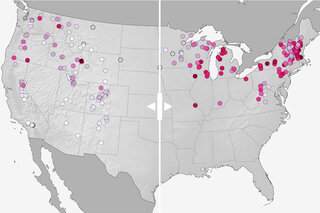
Compare projected changes in downhill ski season length by 2050 if we follow a moderate versus a high pathway of carbon emissions.
View this tool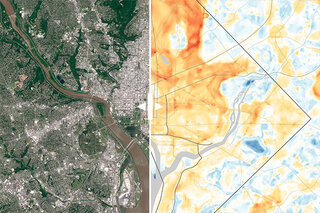
Heat maps and matching satellite images with a slider. Viewers can get a sense of how and why DC and Baltimore experience such a wide range of temperatures on a hot summer day.
View this tool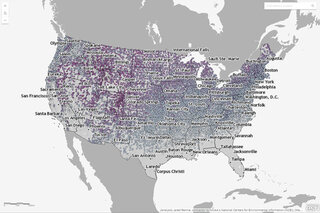
This interactive map shows the latest day for which snow greater than 0.1 inches was recorded for thousands of U.S. weather stations during their period of operation (up through April 11 of 2018).
View this tool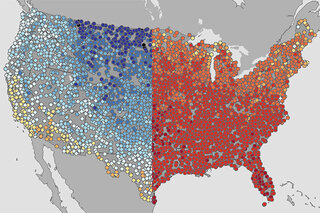
To highlight spring’s extremes, here are maps of the warmest and coolest first day of spring (March 19) recorded at thousands of U.S. weather stations during each station’s history.
View this tool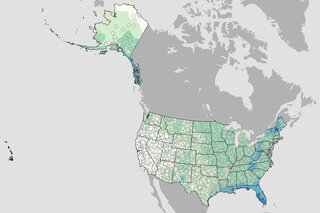
What are the chances of rain on the Fourth of July? This map shows the historic probability of there being of at least 0.1 inch of rain on the July 4 based on the latest U.S. Climate Normals from NOAA NCEI.
View this tool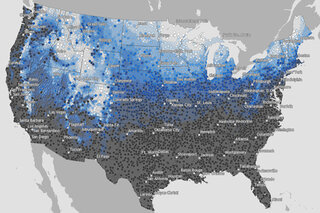
Map of the historic probability of there being at least 1 inch of snow on the ground in the Lower 48 states on December 25 based on the latest U.S. Climate Normals from NOAA NCEI.
View this tool