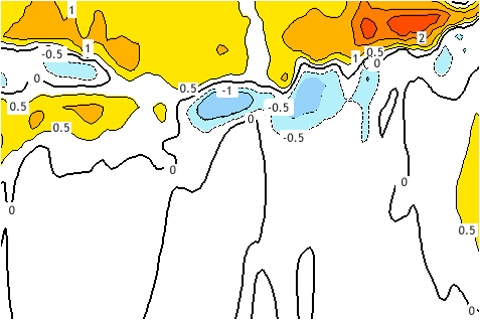
Sea surface temperatures were chugging along in late fall of 2014. What's going on now?
Sea surface temperatures were chugging along in late fall of 2014. What's going on now?
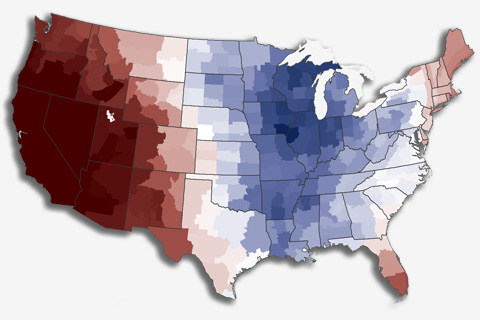
The Lower 48 United States was 0.5°F above average in 2014, making it the 34th warmest year in the historical record (1895-2014). It was the 18th year in a row with above-average temperature.
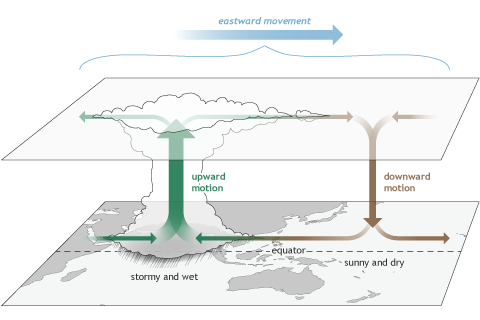
Several times a year the MJO contributes to various extreme events in the United States, including Arctic air outbreaks during winter across the central and eastern portions of the country.
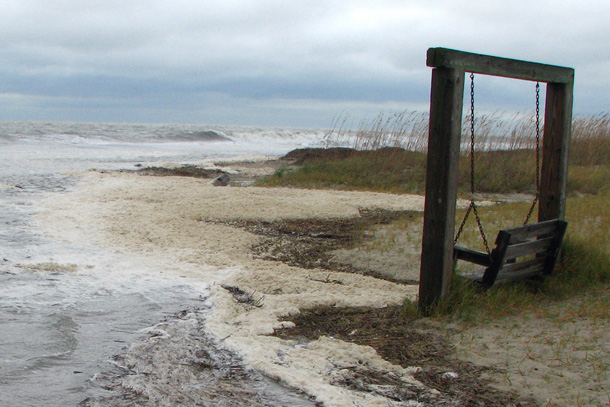
Maps and images from NOAA's online sea level rise viewer helped city officials in Tybee Island, Georgia, raise awareness of the city's vulnerabilities and set priorities for adaption efforts.
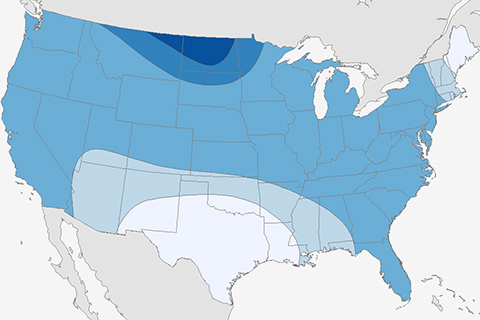
A first look at how we evaluate seasonal forecasts. How well do our eyes do?
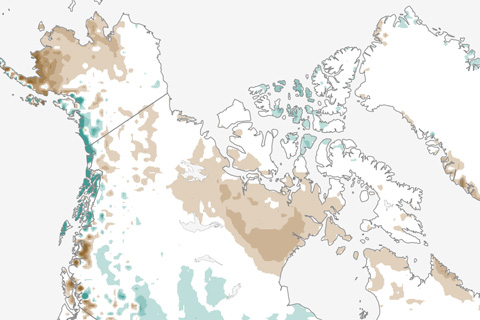
April snow extent was record low across Europe and Asia, and in June, the entire Northern Hemisphere was below average for the tenth year in a row. Spring snow is disappearing even more rapidly than Arctic sea ice in summer.
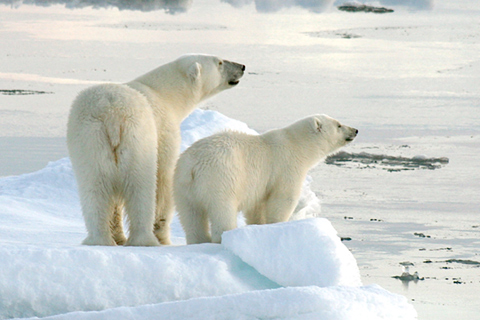
Sea ice changes are key to polar bear health and numbers. Only one of the evaluated groups is increasing. Several are stable; a few are already declining
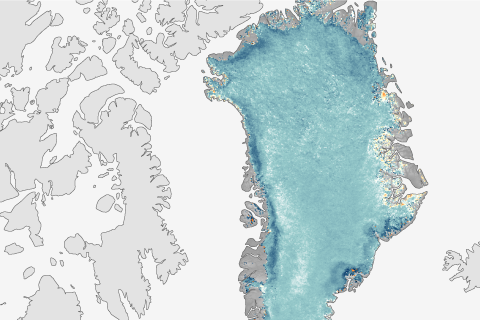
Punctuating a trend of declining reflectivity, the Greenland Ice Sheet reflected less sunlight in August 2014 than it did in any previous summer on record.
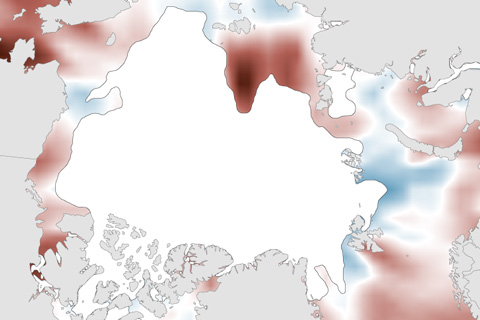
Compared to 2012’s extreme warmth, surface water temperatures were more moderate in summer 2014. Nevertheless, pockets of very warm temperatures existed.
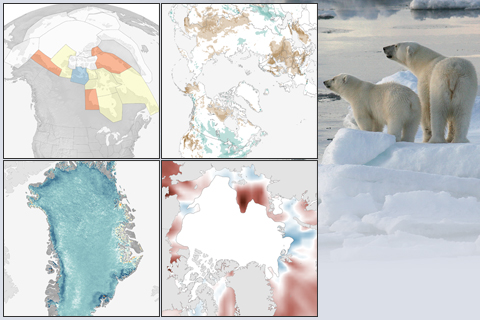
The latest installment of NOAA's Arctic Report Card confirms that Arctic air temperatures are rising at more than twice the rate of the planet as a whole. This collection of images highlights some of the key changes in physical and biological conditions in the Far North.