Q&A with NOAA El Niño expert Michelle L'Heureux
Earlier this month, NOAA declared an El Niño Advisory, which means El Ninõ conditions are underway in the tropical Pacific and are expected to persist. El Niño is the warm phase of the planet's most influential natural climate pattern: the El Niño-Southern Oscillation, or "ENSO" for short.
During El Niño, the waters of the central-eastern tropical Pacific warm up, and rainfall there becomes heavier than it usually is. These changes disrupt the large-scale flow of the atmosphere for thousands of miles up- and downstream of the Pacific—including in the United States. Impacts are never guaranteed, but the presence of El Niño does tip the odds toward certain seasonal average climate conditions, including an active hurricane season around Hawaii and a wet winter across the southern tier of the United States.
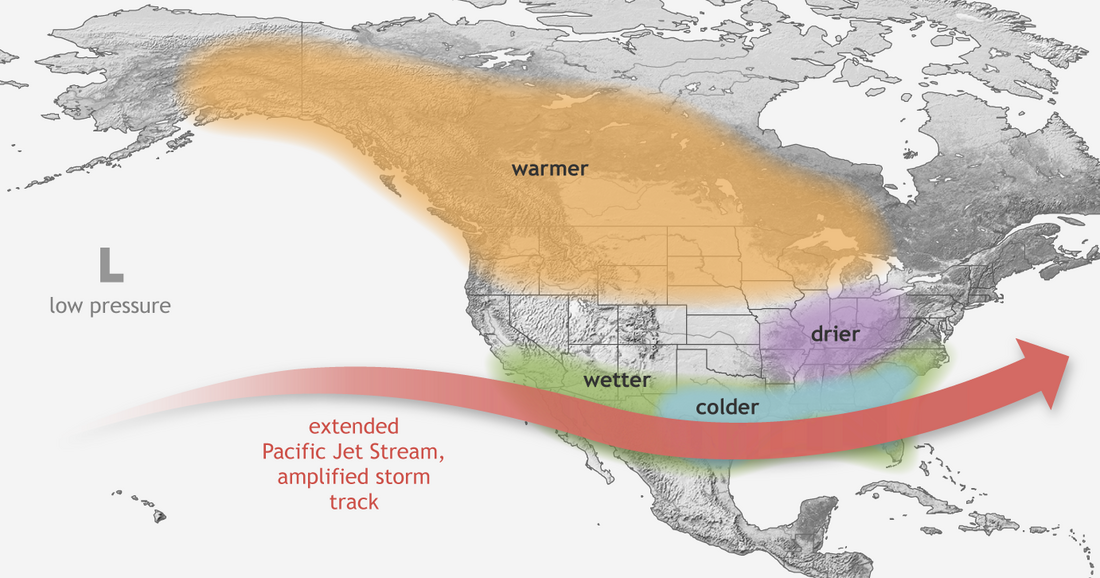
Typical winter impacts of El Niño across the United States include a wetter winter in the southern tier of the country, and warmer winter across parts of Alaska and Canada. NOAA Climate.gov illustration.
Forecasters and weather watchers have been buzzing about this El Niño for months. Seasonal climate models effectively thumbed their noses at the normal ENSO "spring predictability barrier" and began shouting "El Niño" as far back as December. As the year has gone on, models have continued to converge on the notion that the event will be a strong one.
Via email, I asked NOAA's lead ENSO forecaster, Michelle L'Heureux, some questions about the ongoing event, including what could still derail it from becoming the monster some think it will be. Below are her lightly edited responses.
Climate.us: All over the internet, people are referring to the current El Niño event as a possible “super El Niño.” That’s not a real thing, right? How do you categorize the strength of these events?
L’Heureux: I agree, this year the internet buzzword to describe El Niño is clearly “Super.” Back in 2015, it was all “Godzilla.” I am guessing next time a strong or very strong El Niño is in the forecast, the buzzword will be some other exaggerated superlative or monstrous creature!
[Climate.us: At the ENSO Blog, we countered 'Godzilla' with the suggestion that we name strong events after action movie heroes.]
At NOAA, we categorize El Niño (and La Niña) strength using weak, moderate, strong, and very strong. Since the threshold for El Niño is +0.5 degrees Celsius (C) above average in a region of the east-equatorial Pacific Ocean, we use that same 0.5C increment to define the boundaries of the other categories too. So weak is 0.5C up to 1.0C, moderate is 1.0C up to 1.5C, and so on, all the way up to 2.0C or greater to describe “very strong” events. Since 1950, we have seen 7 very strong El Niños. The biggest El Niño was in winter 1982-83, when we touched +2.5C.
The most recent very strong El Niño, in winter 2015-16, highlights the limitations of using exaggerated language to describe El Niño events. In that situation, everyone was expecting Godzilla-sized impacts to line up with an event that was literally being called "Godzilla El Niño" (note: this was not language used by NOAA). But those impacts did not materialize in parts of the United States. Californians felt that most acutely when they saw below-average precipitation in a winter when they expected wetter conditions. That’s why we try to emphasize—it’s written on our ENSO strengths outlook graphic—that stronger events do not always lead to stronger impacts; it just makes certain outcomes more likely.
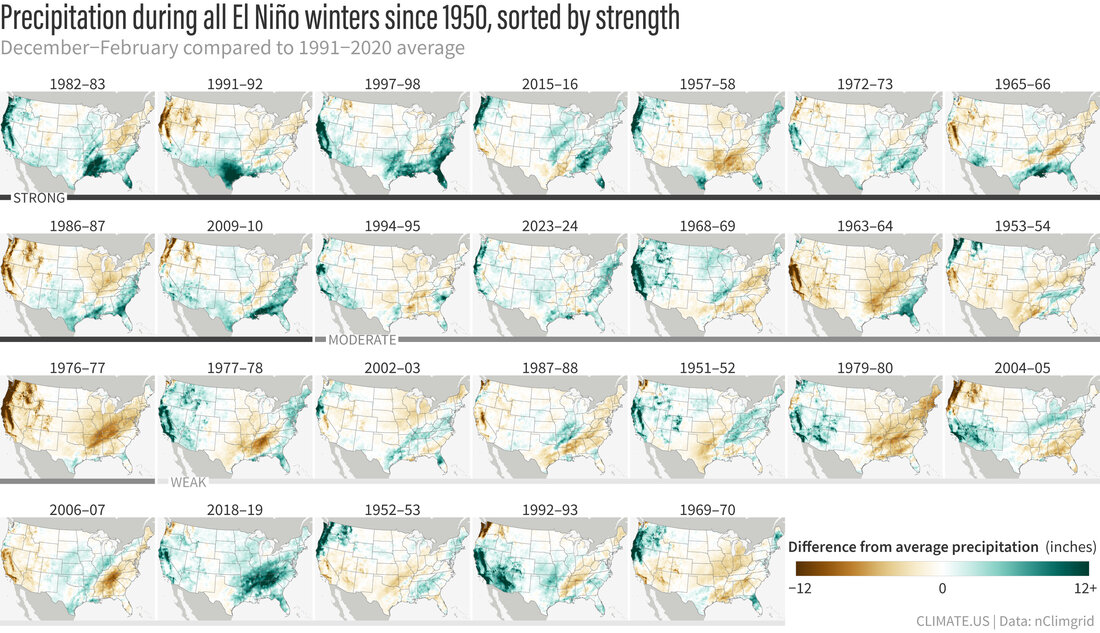
U.S. winter (December–February) precipitation for every El Niño since 1950. Maps are ordered from upper left to bottom right based on the strength of the event during winter, based on the Relative Oceanic Niño Index value. Places that were wetter than average are blue-green; places that were drier than average are brown. Details and other formats. Climate.us maps, based on NOAA nclimgrid data.
Climate.us: NOAA's new Relative Oceanic Niño Index (RONI) compares the temperatures in the ENSO-relevant part of the tropical Pacific to the temperature of the entire tropical ocean. Why is this a better way to predict how the atmosphere is going to respond than the traditional Oceanic Niño Index (ONI)?
L’Heureux: RONI borrows from earlier research by the tropical cyclone community who found that relative sea surface temperatures (SSTs) were better linked to the potential intensity of hurricanes. The reason that relative SSTs are better linked to rainfall and storminess is because the tropics are a place where local changes in SSTs relative to the tropical mean SSTs strongly determine where rainfall sets up. This is not the case outside the tropics.
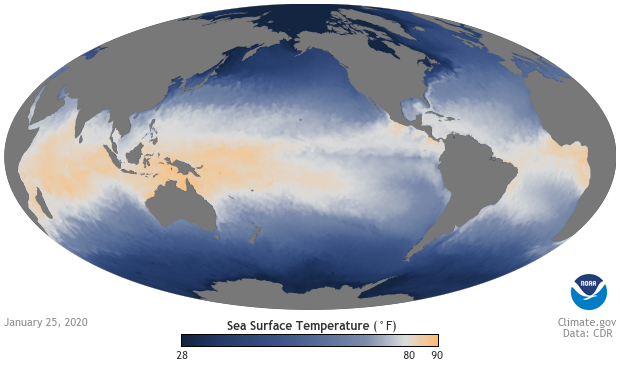
Most of the time, surface waters in the tropical Pacific Ocean are cooler in the east than they are in the west. The temperature difference generally causes rainfall and convection to be much more vigorous in the west. NOAA Climate.gov Data Snapshots map.
In addition to the reason above there are two other reasons we prefer RONI:
- The classification of past El Nino and La Nina events is more stable with RONI. Because El Nino/La Nina are a departure from average, this means what is considered “the average” can change over time. With RONI, what is considered “the average” is less important to how El Nino/La Nina events are identified than with ONI.
[Climate.us: Thanks to global warming, the average sea surface temperature is definitely changing over time. NOAA's first step in dealing with the influence of warming on ENSO monitoring was back in 2013, when they adopted a rolling climatology that shifted over time.)
- We are also noticing that model forecasts of RONI seem better than ONI over the past decade or so. This could be because trends embedded in ONI are more difficult for the models to predict.
Climate.us: Online discussion about this event has centered almost exclusively on the size of the predicted SST anomalies. Given that ENSO is a coupled phenomenon between the ocean and the atmosphere, is the predicted SST anomaly a reliable way to forecast the ultimate strength of the event? Is it a reliable way to predict seasonal climate impacts at a local scale?
L’Heureux: A stronger El Niño can push the atmospheric circulation so it preferentially flows in certain pathways more than others. When I write "circulation," I’m talking about the general flow of air that moves around the planet, which can guide weather systems and storms in certain directions. But El Nino will not provide details on daily weather events, like when they will happen or how intense they will be.
El Niño primarily helps us to predict the seasonal (3-month) average changes in precipitation, temperature, etc because it can influence features like the jet stream, a river of air that moves from west to east over the North Pacific Ocean. Over the United States the shifts in the jet stream, especially during the winter and early spring, make it more likely the storm tracks and precipitation will set up along the southern tier of the United States (at the same time, it tends to reduce the odds of precipitation over the northern U.S.).
Because El Niño tends to form in advance of its peak impacts, we can make probabilistic outlooks (like these) many months in advance. A stronger El Niño makes it more likely these impacts will occur, but they are never guaranteed. A stronger El Niño also does not ensure that the intensity of the local impacts will be more severe—it opens the door for more extreme events, but it is not going to tell you exactly when and where they will occur.
Further, there is research showing that El Niño relationships with precipitation/temperature/winds/etc are more reliable for larger geographic domains than smaller local domains. El Nino is like an impressionist painter…the painting becomes more obvious when you stand farther away than when you focus on one tiny part of the painting.
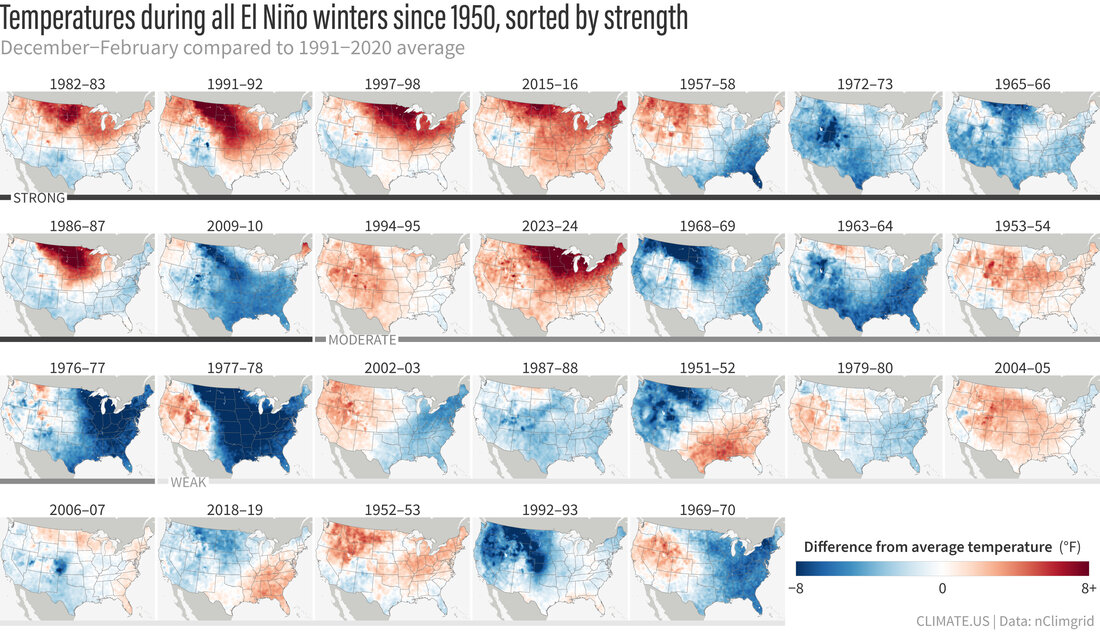
U.S. temperatures for every La Niña winter (December–February) since 1950 compared to the 1991–2020 average. Maps are ordered from strongest to weakest from upper left to bottom right based on the Relative Oceanic Niño Index value in December–February. Places that were warmer than average are red; places that were cooler than average are blue. These maps have not been de-trended to remove the influence of global warming on winter temperatures. Details and other formats. Climate.us image, based on NOAA nclimgrid data.
Climate.us: Seasonal models seem to have coalesced on predicting this El Niño unusually early in the year. What factors do you think were most important to that early consensus? What factors might still derail its development into a strong or very strong event?
L’Heureux: Thanks for picking up on this. If you go back to the early December 2025 forecast, the NOAA ENSO team was favoring El Nino to develop in mid-2026. This was unusually early, but the models were pretty confident in picking up an El Nino signal at that time, so the forecasters began to hedge in favor of El Nino. We issued an El Nino Watch in early March 2026 after the chances of El Nino became larger and it was clearer the ocean was transitioning that direction.
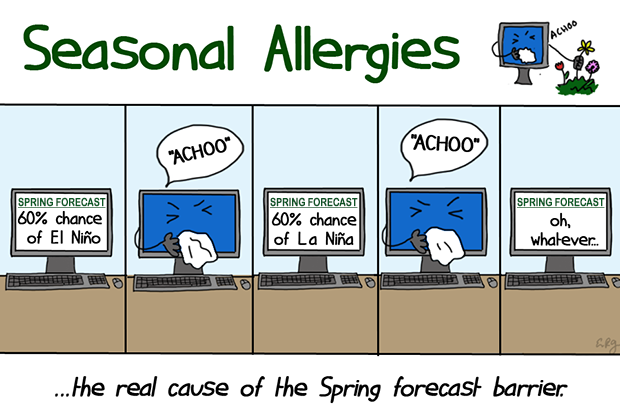
Forecasts for El Niño and La Niña made in the Northern Hemisphere spring months tend to be less accurate than forecasts made at other times of the year. Experts call to this seasonal reduction in skill the "spring predictability barrier." Illustration by Emily Greenhalgh, NOAA Climate.gov.
The primary factor that forecasters consider are seasonal climate models, and the signals in these models were unusually strong for early in the year. While we are more cautious in the spring months because of the spring prediction barrier (a feature that reduces model accuracy), it is also known that the strongest El Nino events tend to develop earlier in the calendar year. Given the models and the observed evolution to that point, the team decided it was time to begin alerting the public to the potential El Nino.
While we are currently confident in the continuation of El Nino (near ~100% chance of at least a weak El Niño in November-January), the peak intensity of the El Nino is still a wild card. Presently, we see a lot of warmth below the surface the equatorial Pacific Ocean—that is the “fuel” for El Nino growth. We are also starting to see it emerge at the surface of the ocean.
However, we also know that the intensity El Nino will likely be determined by the details of short-term weather that we cannot predict months in advance. Specifically, the low-level winds that blow along the equator need to periodically weaken in order to see a stronger El Nino. If the winds were to instead strengthen for some extended duration of time, then that would reduce the chances of a strong or very strong El Nino.
NOAA updates its ENSO outlook once a month on the 2nd Thursday of every month, and the team will be watching closely for any changes in the upcoming evolution.