U.S. temperature and precipitation outlook for November 2026
Official NOAA climate statistics for October won’t be available until later in the month, but preliminary temperature analysis shows October 2026 was warmer than average nearly coast to coast—extremely so in the heart of the country. Precipitation was more uneven, with a bull’s-eye of significant wetness in the Southwest (driven by the remnants of tropical storms) surrounded by dryness in the Pacific Northwest, Northern Plains, and the Mississippi River corridor. The impact on drought conditions is apparent in the maps below, which contrast conditions in mid-September to conditions in late October.


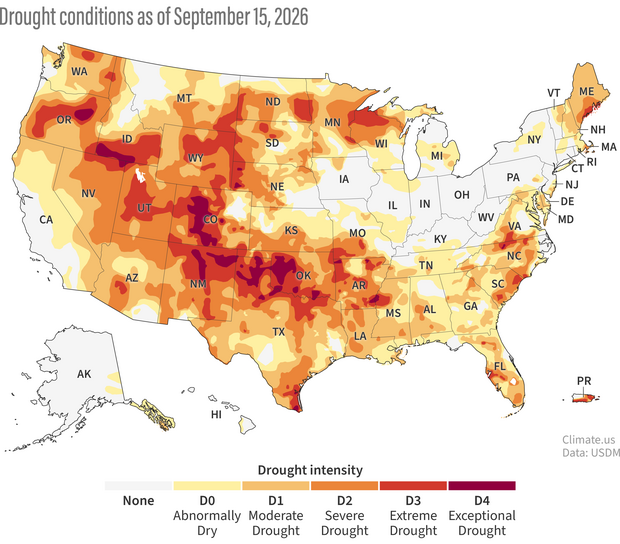
Drought conditions across the United States on September 15, 2026. Much of the country was at least abnormally dry (yellow), and large parts of the West were dominated by drought that ranged from severe (dark orange) to exceptional (dark red). Climate.us map based on data from the U.S. Drought Mitigation Center.
The moisture in the Southwest helped ease drought conditions there, but large areas of at least moderate drought dominated the country’s West and South as of the U.S. Drought Monitor map from October 29. Pockets of exceptional drought are scattered in Idaho, Wisconsin, Colorado, Oklahoma, Arkansas, and Louisiana.
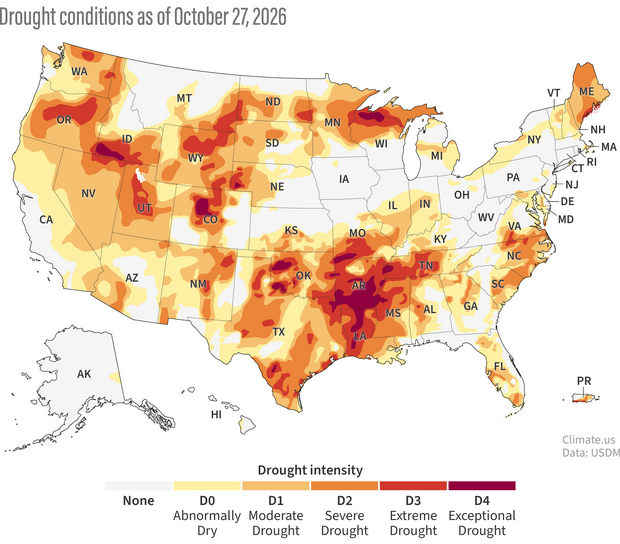
Drought conditions across the United States on October 27, 2026. Much of the country was at least abnormally dry (yellow), and large parts of the West were dominated by drought that ranged from moderate (light orange) to severe (dark red). In the southern Mississippi River basin, drought conditions were especially intense. Climate.us map based on data from the U.S. Drought Mitigation Center.
No parts of the U.S. are favored to have a cooler-than-average November
NOAA’s temperature outlook for November 2026 is shown in the maps below. No part of the contiguous United States or Alaska is blue, meaning favored to have a cooler-than-average November. In terms of whole states, forecasters have given only Arizona, New Mexico, and Texas an “equal chances” forecast, meaning a relatively warm, cool, or average November is equally likely. (For these forecasts, above- or below-average mean “in the warmest/coolest or wettest/driest third of Novembers on record from 1991-2020.”) The rest of the country leans toward a warmer-than-average November, with the highest chances of above-average temperatures in the northern part of the country.
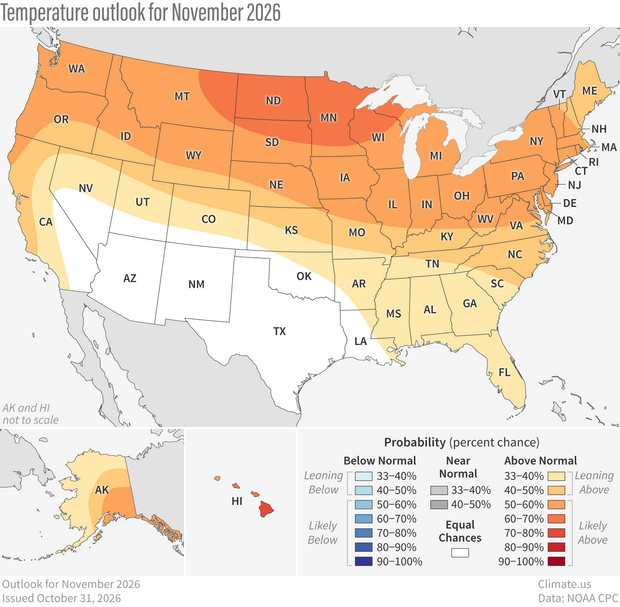
NOAA temperature outlook for November 2026. Any red/orange area means a warmer-than-average November is more likely than a cooler-than-average one. Darker colors mean higher chances, not bigger temperature extremes. White areas mean the chances for a warmer-than-average November, a cooler-than-average November, or a near-average November are equally likely. See our explainer for a deeper dive on how to interpret these maps. Climate.us maps, based on data from the Climate Prediction Center.
More of the U.S. is leaning toward a wet November than a dry one
Large parts of the contiguous United States as well as the southern coast of Alaska are at least “leaning” toward a wetter-than-average November. The highest chances continue to be in the Southwest and parts of the Upper Midwest. In contrast, western Alaska, the Northern Rockies and parts of Michigan are leaning toward a drier-than-average November.
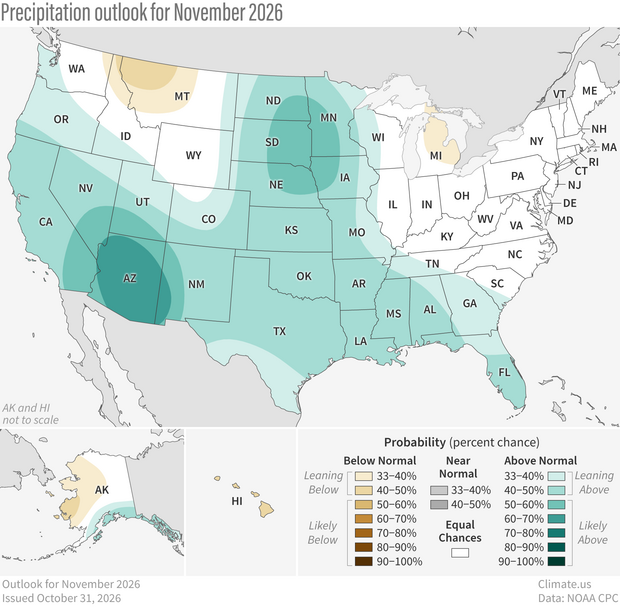
Caption: NOAA precipitation outlook for November 2026. Any green area means a wetter-than-average November is more likely than a drier-than-average one. Darker colors mean higher chances, not bigger precipitation extremes. White areas mean the chances for a wetter-than-average November, a drier-than-average November, or a near-average November are equally likely. See our explainer for a deeper dive on how to interpret these maps. Climate.us maps, based on data from the Climate Prediction Center.
What’s behind the November U.S. climate outlooks?
The monthly climate outlooks reflect a forecaster’s judgement based on a wide range of forecasting tools. According to the discussion published at the end of October, the ongoing El Niño event is the dominant natural pattern influencing the November outlook, but they are also keeping an eye on the status of a natural climate pattern called the Madden Julian Oscillation—which can influence precipitation extremes over the United States—as well as the possibility of a sudden stratospheric warming (SSW) event later in the month, which often brings unusually warm conditions to the Arctic and unusually cool conditions to the mid-latitudes, including potentially the eastern United States.
According to the NOAA discussion (links added by Climate.us):
A November SSW is very rare, and should this occur, impacts can be seen for up to 2 months, usually manifesting as a negative Arctic Oscillation (AO) phase, which can already be seen in models. A negative AO is in contrast with the forecasted phase of the Pacific-North American (PNA) pattern, which is more in alignment with El Nino. These factors add some uncertainty to the eastern U.S., where some of the potential impacts of a SSW and negative AO compete with those from El Nino.
Related reading
- Our Polar Vortex Blog, which ran from November 2023–June 2025, has more background on Sudden Stratospheric Warming events (SSWs), what causes them, how experts forecast them, and how they impact weather way down here at the surface.
- NOAA’s 2026-27 winter outlook
- A guest post from our ENSO blog in 2020 about how the Madden Julian Oscillation (MJO) and El Niño affect U.S. rainfall
- NOAA ENSO expert Michelle L’Heureux’s 2019 ENSO Blog post about how El Niño influences the Pacific North America pattern