Highlights from NOAA's October 2026 El Niño forecast
The word from NOAA on El Niño came out this morning, and, no surprise, the planet’s most powerful natural climate disrupter got 💪-er in September, pushing up the odds that this event will soon become the 💪-est on record. And while most of El Niño’s impacts on the continental U.S. happen in the winter, one of its most consistent impacts will be felt sooner in California: high-tide flooding. In this week’s post, I’ll give you a quick rundown on current conditions and highlight a web app that you can use to view the high-tide flood outlook for your location.
What’s going on in the ocean?
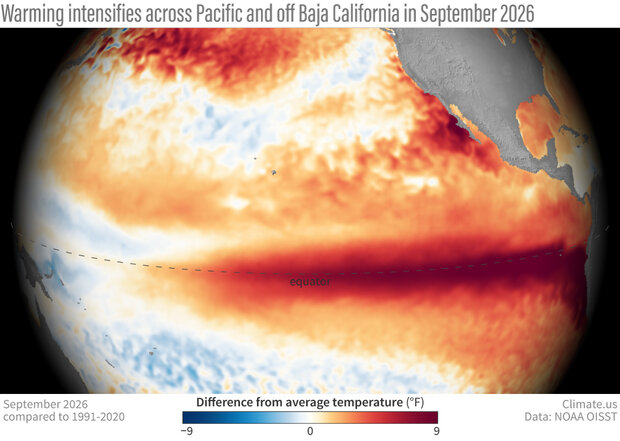
Pacific Ocean surface temperatures in September 2026 compared to the 1991-2020 average. The extremely warm waters across the equator (dark red) are one indicator of a strengthening El Niño event. Climate.us image, based on NOAA OISST data.
Surface water temperatures in parts of the eastern tropical Pacific averaged 5 degrees Celsius above average (9 degrees Fahrenheit) in September based on NOAA’s OISST data set. Now, part of that warm anomaly is due to things besides El Niño (I’m 👀 at you, global warming), so for tracking the strength of Niño, NOAA now subtracts the tropics-wide anomaly from the traditional anomaly. They call this the relative sea surface temperature anomaly.
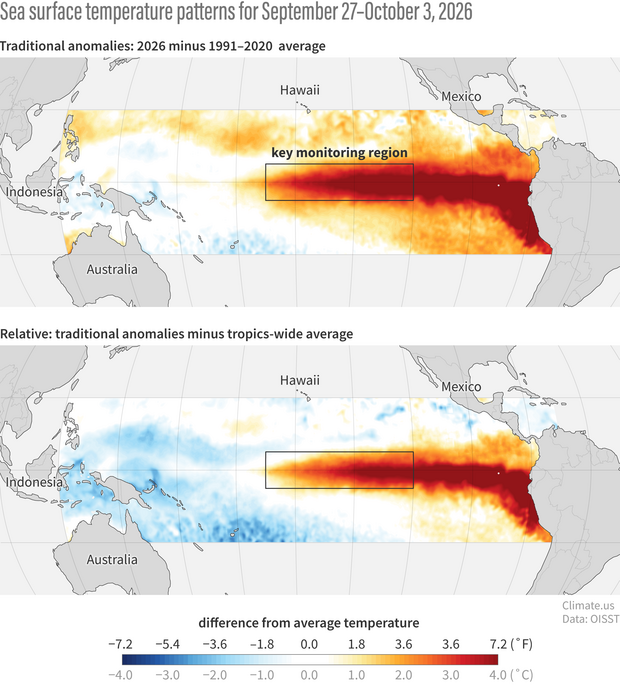
Traditional temperature anomaly (top) and the anomaly relative to the entire tropics (bottom) across the tropical Pacific from September 27–October 3, 2026, compared to the 1991-2020 average. The relative anomaly better shows the difference in temperature across the basin. That cool-to-warm gradient from west-to-east is not normal for the area, and it shifts where rainfall and convection happen. Climate.us maps, based on NOAA OISST data.
In the central tropical Pacific, which is the key ENSO-monitoring region, NOAA reported that the relative temperature anomaly increased from 1.7 degrees Celsius in August to 2.1 degrees C in September (from 3.1 to 3.8 degrees Fahrenheit). If you paid attention to our Q&A with NOAA forecaster Michelle L’Heureux back in June, that 2 ˚C value might be ringing a few 🛎s. Does a relative anomaly of more than 2 ˚C in the Niño 3.4 region mean that the current El Niño is officially a 💪💪 (very strong) event?
Technically, no, because NOAA does not rank El Niño or La Niña events based on single-month anomalies, but on seasonal (3-month-average) scales. (That’s why, as Michelle explained during the 2015 El Niño, you generally won’t find us making a fuss over the latest daily or weekly anomalies. I mean, of course we 🫣 at them. But we keep our 🤐 and don't get overexcited about every new record.) The latest 3-month “season” available is July-August-September, which had a Relative Oceanic Niño Index value of 1.7. So, we will have to wait and see whether the August-September-October seasonal average exceeds 2.0 before we can officially label the current event “very strong.”
According to this morning’s forecast, however, the odds are looking good. And by “good,” I mean, it’s basically a sure thing: 100 percent chance that the event will become very strong by the Sep-Nov season. The odds that the event will set a new record are also high:
Chances remain high for a historic event that would exceed the strength of previous El Niño events dating back to 1950 (+2.5°C or more for a 3-month RONI value): the chance is 54% for September-November, 83% for October-December, and 70% for November-January.
What’s the atmosphere up to?
Thanks to the buildup of warm surface water in the central Pacific, clouds and rainfall have shifted there from their “preferred” location over the equatorial western Pacific. This mirroring of sea surface temperature anomalies in cloud/rainfall anomalies is a sure sign of the ocean-atmosphere feedback loop that is essential for continued strengthening of El Niño.
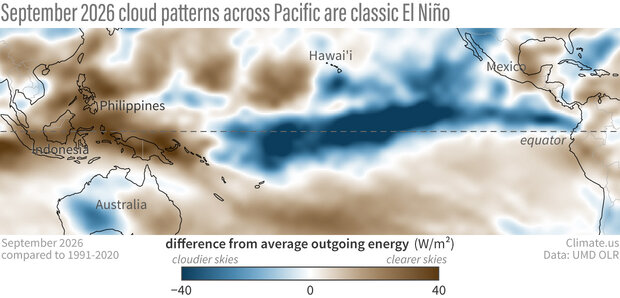
Cloud patterns across the tropical Pacific Ocean in September 2026 compared to the long-term average (1991-2020). Brown areas, such as over Indonesia and the far western Pacific, mean clearer skies than average. The blue colors dominating the central and eastern Pacific mean cloudier skies than average. This pattern—dry to the west, wet to the east—is a classic sign of El Niño. Climate.us image, based on UMD outgoing long wave radiation data.
Cloud patterns in September 2026 compared to the 1991-2020 average, inferred from satellite observations of thermal infrared energy escaping at the top of Earth’s atmosphere (also called “outgoing longwave radiation,” or OLR). Places where skies were cloudier than usual are blue; places where skies were clearer than average are brown. Climate.us image, based on OLR data from University of Maryland.
Not only are the cloud/rainfall patterns over the equatorial Pacific consistent with a strong El Niño, but we can also see some of the more distant impacts (aka “teleconnections”) of El Niño taking shape. Hawaii was cloudier than average, which is common in the fall during El Niño. At the far right of the image, satellites observed unusually clear skies over significant parts of southern Mexico, Central America, the Caribbean, and northern South America.
That dryness downwind of the Pacific is linked to El Niño’s disruption of the large-scale atmospheric circulation across the tropics. The warm waters over the central tropical Pacific make the overlying air warm and buoyant. Rising air in that part of the Pacific eventually sinks back toward the surface over Central and South America. September’s cloud maps suggest that some of El Niño’s typical long-distance impacts are taking shape. See our schematic below to see other temperature and precipitation impacts to be on the lookout for in coming months.
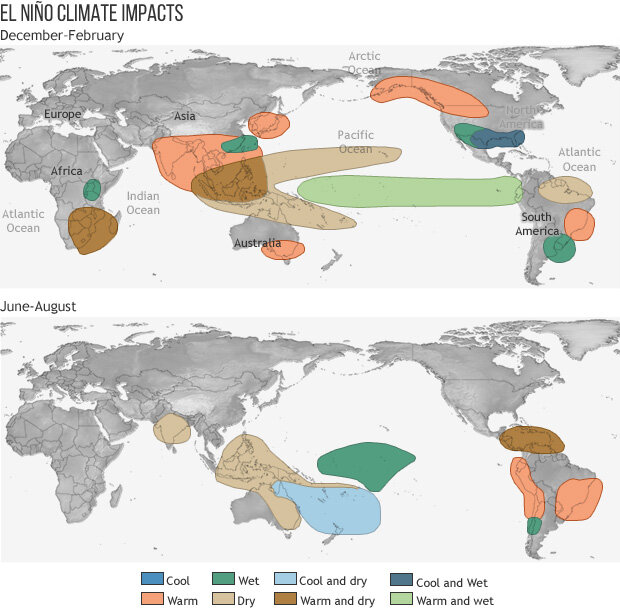
These maps show winter and summer global ENSO impacts.
First things first: Get ready for coastal flooding
One of the most consistent impacts of El Niño on the United States is an increase in high-tide flooding during the cool season. Many parts of the U.S. have already seen a significant increase in the number of days each year with high-tide flooding—also sometimes called “nuisance flooding” or “sunny-day” flooding—due to local sea level rise.

Nuisance flooding impacts may not be life threatening, but they can disrupt transportation, damage infrastructure, and strain city and county maintenance budgets. Due to sea level rise, the frequency of high-tide nuisance floods are rapidly increasing along U.S. coasts. Cartoon by Emily Greenhalgh.
El Niño tacks some additional days on, not just for Hawaii and the West Coast, but also for the western Gulf of Mexico and even the Mid-Atlantic. If you want to read more about how it does that, we have a great blog from 2023 about the influence of El Niño on coastal flooding. The TL;DR summary: In Pacific coastal areas, it’s due to Kelvin waves and warmer-than-average water. Elsewhere, it’s through El Niño’s influence on the average location of the jet stream and other features of the atmospheric circulation. For example, in places where El Niño increases on-shore winds, we see more flooding.
So if you live, work, or plan to vacay in a coastal county, it’s definitely time to start paying attention to the heightened risk for high-tide flooding. California, in particular, will be seeing impacts sooner rather than later. NOAA has a tool to help you understand your local risk. The screenshot below is from an interactive web map for NOAA’s 2026-27 High-tide flood outlook.
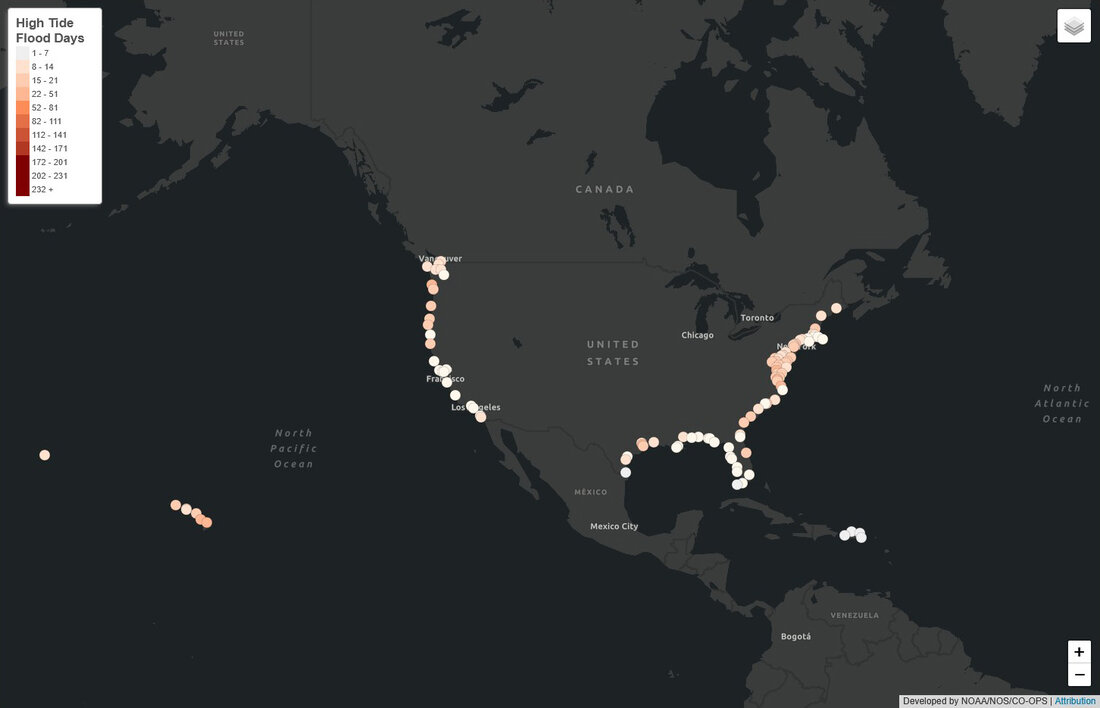
Screen capture of the NOAA high tide flooding outlook interactive map for 2026-2027.
Besides its usefulness for planning for the season ahead, the flood outlook app offers a look at how continued sea level rise will affect high-tide flooding in coming decades. One thing it reveals is that in some parts of the country, today’s strong El Niño is a preview of what sea level rise will make routine in the next decade. Take the case of Sewell’s Point, Virginia, which is forecast to see more than 20 high-tide flood days during the 2026-27 monitoring year.
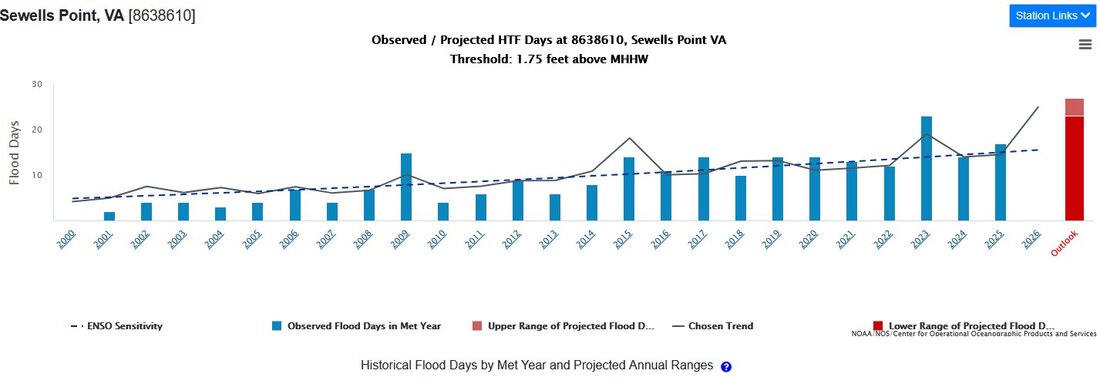
Screen capture of a graph from the NOAA high tide flooding outlook interactive map for 2026-2027, focusing on Sewells Point, VA.
Now compare that to the projections for the coming century.
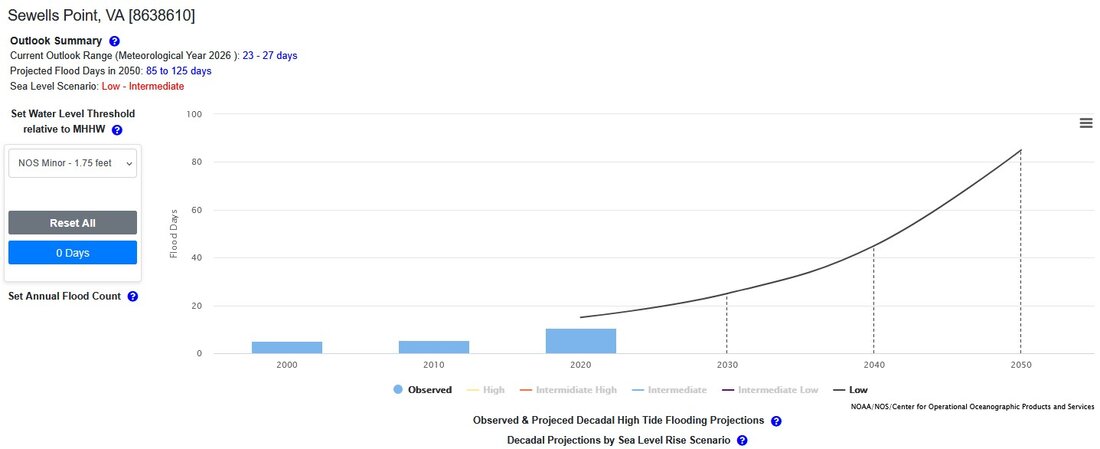
Screen capture of a graph from the NOAA high tide flooding outlook interactive map for 2026-2027, focusing on projections for Sewells Point, VA.
By 2030, the annual average number of flood days is estimated to be around 25 days—similar to what this year’s El Niño is forecast to bring—even under a scenario with low rates of sea level rise. By 2050, the number of high-tide flooding days is projected to be over 80 per year, and of course an El Niño year would likely have even more!
Here’s your “at least…”
There’s no sugarcoating the reality that more sea level rise is coming, and it does and will impact us in ways that range from dangerous and deadly to inconvenient and expensive. As our bloggers wrote back in 2023:
More frequent high-tide flooding is converting saltmarshes to mudflats, changing coastal ecosystems, infiltrating groundwater, degrading storm and wastewater systems, flooding streets, and slowing commutes and commerce alike. In short, our critical infrastructure and natural resources are in the tide’s way, and the tide is not backing down!
But here’s what I tell myself about this and all the other bad things that the climate can throw at us: at least we are not going into these challenges with blinders on. Scientists are still working incredibly hard to better understand the climate system and how it works so that they can provide society things like this flood outlook tool, which coastal residents and county, state, or tribal governments can use to prepare right now, this very season, to reduce their vulnerability to the impacts of El Niño, and also to plan for the more distant future. Thinking about sea level rise may be uncomfortable, but I’ll take information over ignorance any day.
Reviewed by Emily Becker.