Super El… global average surface temperature?
All year, there’s been a lot of speculation about if 2026, with a very strong El Niño on top of the global warming trend, will be the warmest year on record. And by warmest year, I mean the global average temperature would break the previous record, set just 2 years ago by 2024. The global average temperature is a single number that represents the surface temperature averaged over the entire planet. In El Niño years, that number is a few tenths of a degree higher, while in La Niña years, it’s a few tenths of a degree cooler, all superimposed on the steady upward trend.
What is the global average surface temperature?
But first, why would anyone care about the temperature of the entire planet? It’s not like you get out of bed in the morning and check your local National Weather Service station to see what the forecast is for the planetary average surface temperature. Day-to-day variations of the global average are largely meaningless—instead, we follow the change in global temperature on monthly, annual, and longer timescales because it shows us the overall change in Earth’s climate.
The Earth’s climate is governed by our proximity to the sun, the size of the planet, the presence of water, and so on. The climate changes based pretty much entirely on one factor, though: the energy balance—the amount of energy from sunlight coming into the Earth versus the amount of energy being radiated back to space. Many factors influence the energy balance, including temporary things like volcanoes (ash particles in the atmosphere reflect sunlight back into space) and cyclical influences such as the amount of energy coming in from the sun.
According to long-term records like ice cores, the global temperature normally goes up and down from year to year (here’s where El Niño comes in!), but these shifts average out over many years. Real change in the climate occurs when the energy balance changes, for example due to an increase in greenhouse gases. Usually, changes in greenhouse gases take thousands of years, but over the past century, the primary contributor to climate change is the release of carbon dioxide and other greenhouse gases from human activities.
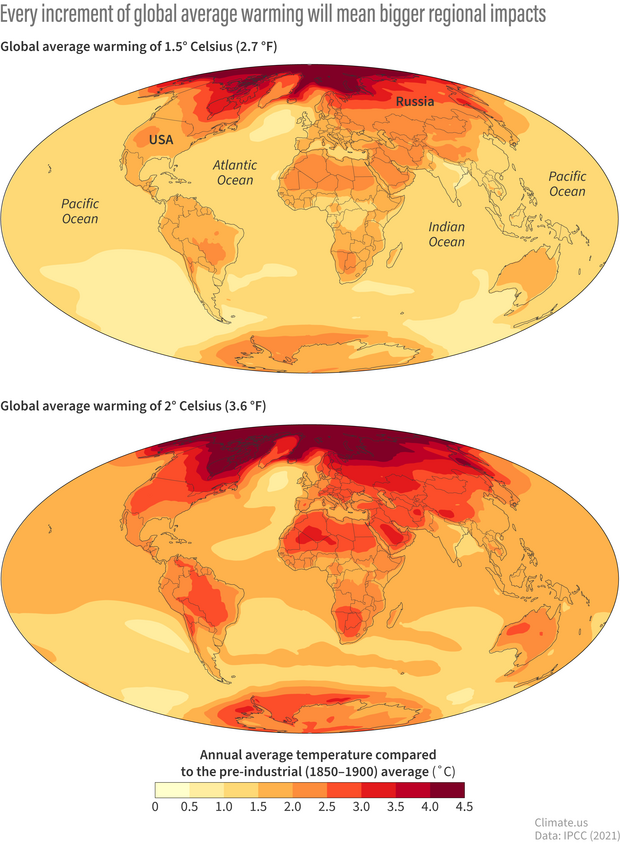
At global average warming levels of 1.5 degrees Celsius (top map) above Earth's pre-industrial temperature, some land areas will experience twice that much annual warming. At global warming of 2 degrees Celsius (bottom map), those regional differences become more extreme. Climate.us maps, based on data from Figure 5 of the IPCC Sixth Assessment Report's Summary for Policymakers.
A lot of study has gone into the implications of the global warming trend. An increase of 1.5°C in the global average doesn’t translate to even warming everywhere. For example, the U.S. is expected to heat up faster than the global average at every warming level, and the local consequences intensify as the global total creeps upward. Around 1.5°C of global warming, some land areas would already be warming at double the global average, and the gap widens at 2°C. For the U.S., the Fifth National Climate Assessment projects a national average increase of 4.4 to 5.6°F at 2°C (3.6°F) of global warming, with roughly another 2.5°F for each additional degree Celsius.
The impact of El Niño and La Niña
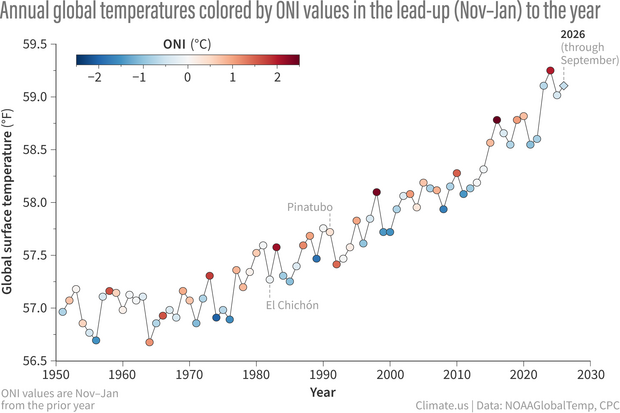
Yearly global surface temperatures (dots) from 1951–2026 (to date, shown by diamond). The dots are colored by the Oceanic Niño Index (ONI) value in the November-January period leading into the year. Dark red means a strong El Niño influence heading into the year; dark blue means a strong La Niña influence. In general, the global average temperature spikes in the year after El Niño first develops. Graph by Emily Becker, based on NOAA temperature and ONI data.
As you can see in this graph, global mean surface temperature (GMST) has been marching steadily upwards since the 1960s, reflecting the aforementioned global warming. However, there are significant year-to-year jogs up and down. The points on the line are colored by the Oceanic Niño Index, our primary metric for measuring El Niño and La Niña events. The strongest El Niño events jump right out as high GMST, while it’s clear that La Niña years tend to be relatively cooler. Given the extremely strong El Niño this year (some might call it Super!), where might 2026 end up?
Before we get to 2026 though, a few details: the warming trend means that El Niño years in past decades, even very strong El Niños, are far below more recent years. Also, while El Niño years are usually the warmest of each decade, there are some notable exceptions: the warming effect of both the 1982–83 and 1991–92 El Niño events was muted by volcanic eruptions.
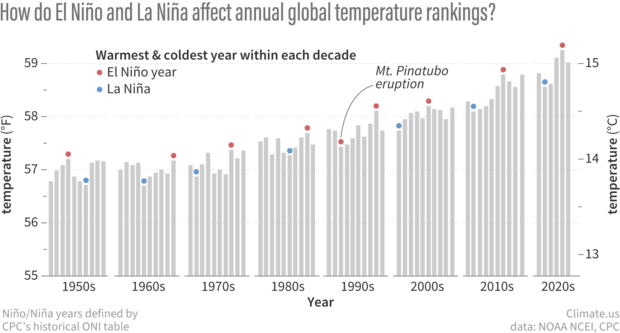
Annual average surface temperatures (gray bars) from 1950 to 2025. The warmest and coldest years of each decade are topped with circles that are colored red if the year was an El Niño year or blue if it was a La Niña year. We considered a year an El Niño/La Niña year if the November-January season leading into the year was labelled as part of a historical episode by NOAA's Climate Prediction Center or if more than half of the months in that year were. Most decades, the warmest year is an El Niño year, and the coldest year is a La Niña year. A notable exception was 1992. It was the coldest year of the 1990s despite being an El Niño year because of cooling from the eruption of Mount Pinatubo in 1991. NOAA Climate.us graph based on data from NOAA National Centers for Environmental Information.
Also, and this is very important: El Niño does NOT warm the planet as a whole, and La Niña doesn’t cool it. Instead, they distribute heat from the surface to other areas where it’s not counted in the surface temperature, such as into the deeper ocean. Before the global warming trend started, El Niño and La Niña-related changes balanced each other out over most decades. (I kind of want to put this paragraph in bold, because ENSO-related, short-term climate change is sometimes blamed for all observed warming by those who don’t acknowledge that global warming is a real thing. But the editorial police Beloved Editor says no more than one sentence of bold at a time.)
Anyway, one more critical note: the dots in the graph above are colored by the ONI from the November–January period that starts the year. So, for example, the 2016 peak is influenced by the El Niño of 2015–16. You’ll notice on the graph that the year that El Niño forms does tend to be relatively warm compared to surrounding years, but the year after is the real peak. This is because of a few complicated processes, but it essentially boils down to the fact that the release of El Niño-related heat from the ocean into the atmosphere takes time.
So what does this all mean for 2026? Well, it’s certain to be in the top 3, all of which have occurred in the past 4 years. I would bet on the top 2, but with only three months left (October’s data isn’t in yet), beating 2024 might be a stretch. However, based on the historical patterns, it seems very likely that 2027 will set a new record, with continued global warming plus the delayed effect of our super El Niño.